

Top 3 Price Prediction Bitcoin, Ethereum, Ripple: Deviation looms as BTC tests bull market support band
- Bitcoin price could drop below $60,000 before next leg up as technicals underscore bearish sentiment.
- Ethereum price brews a recovery, but bearish sentiment in the market will not let it.
- Ripple price could revisit the previous lows of $0.4188 as overhead pressure continues to grow.
Bitcoin (BTC) has shown the weak hand of bulls, with the sentiment spilling over into altcoins. Specifically, a similar gloom is seen on Ethereum (ETH) price and Ripple (XRP) price. Cognizant that capitulation often precipitates a reversal, the market could be primed for deviation.
Capitulation is often the period of reversal.
— Michaël van de Poppe (@CryptoMichNL) April 17, 2024
It might be that the #Bitcoin dominance has peaked after this consolidation and a reversal is on the horizon. pic.twitter.com/iIN4exSUvg
Meanwhile, markets have their eyes peeled on the BTC halving, which is expected in about three days. With this in mind, BlackRock has already front-run the event with the release of a related video. For the moment, it remains a waiting game on BTC as momentum is relatively gone. Traders may consider watching a continued retracement and consolidation on BTC, with altcoins already bouncing up in their BTC pairs.
Also Read: Bitcoin price hangs in balance as bulls await hype involving BTC halving
Bitcoin, altcoins, stablecoins FAQs
Bitcoin is the largest cryptocurrency by market capitalization, a virtual currency designed to serve as money. This form of payment cannot be controlled by any one person, group, or entity, which eliminates the need for third-party participation during financial transactions.
Altcoins are any cryptocurrency apart from Bitcoin, but some also regard Ethereum as a non-altcoin because it is from these two cryptocurrencies that forking happens. If this is true, then Litecoin is the first altcoin, forked from the Bitcoin protocol and, therefore, an “improved” version of it.
Stablecoins are cryptocurrencies designed to have a stable price, with their value backed by a reserve of the asset it represents. To achieve this, the value of any one stablecoin is pegged to a commodity or financial instrument, such as the US Dollar (USD), with its supply regulated by an algorithm or demand. The main goal of stablecoins is to provide an on/off-ramp for investors willing to trade and invest in cryptocurrencies. Stablecoins also allow investors to store value since cryptocurrencies, in general, are subject to volatility.
Bitcoin dominance is the ratio of Bitcoin's market capitalization to the total market capitalization of all cryptocurrencies combined. It provides a clear picture of Bitcoin’s interest among investors. A high BTC dominance typically happens before and during a bull run, in which investors resort to investing in relatively stable and high market capitalization cryptocurrency like Bitcoin. A drop in BTC dominance usually means that investors are moving their capital and/or profits to altcoins in a quest for higher returns, which usually triggers an explosion of altcoin rallies.
Bitcoin price tests bull market support one too many times
Bitcoin price has dipped into the demand zone between $60,364 and $62,412 for the umpteenth time since February. This time, however, it has slipped below its mean threshold at $61,421. Traders should watch the aforementioned level, because a candlestick close below it would confirm the continuation of the downtrend.
The Relative Strength Index (RSI) is below the 50 threshold, with both the Moving Average Convergence Divergence (MACD) and the Awesome Oscillator (AO) in negative territory. These outlooks reinforce bearish sentiment as it indicates strong selling pressure and potential further downside movement in the price.
Traders may interpret this as a signal to consider shorting the asset or being cautious if holding long positions. Enhanced seller momentum could see BTC price drop below $60,000 to collect liquidity residing by way of the March 5 lows around $59,005.
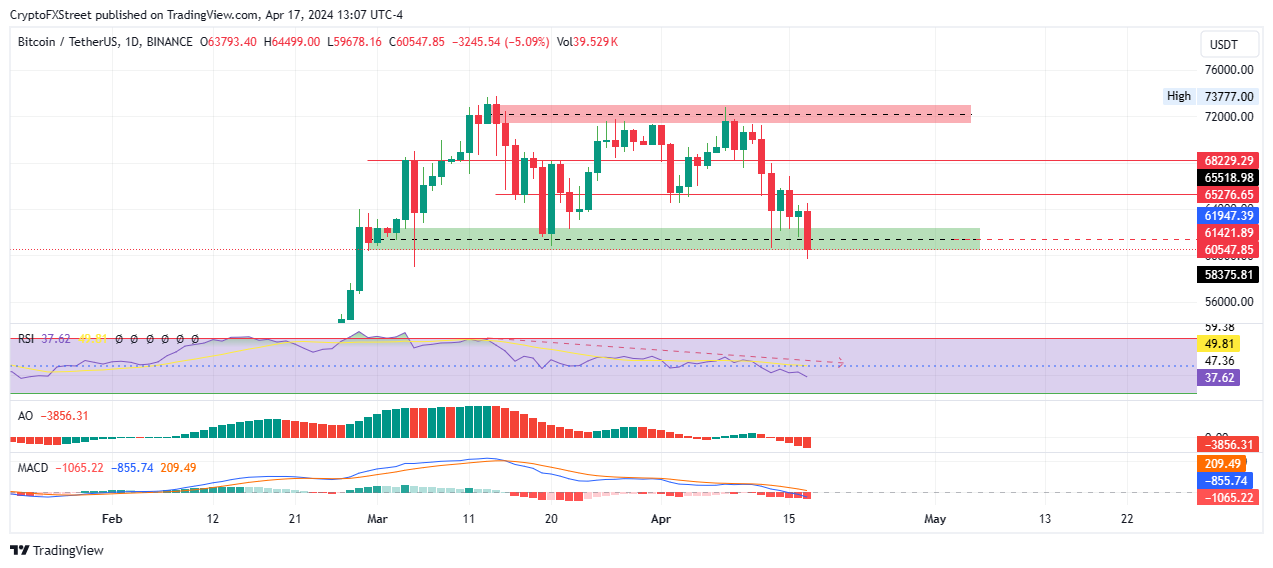
BTC/USDT 1-day chart
On the other hand, a recovery, where the bulls buy BTC at current discounted rates, could promote a recovery. The ensuing buying pressure could see Bitcoin price push north, confirmed by a recovery above $65,276.
An extended move north could send Bitcoin price above $68,229, but confirmation of an uptrend will only occur upon a candlestick close above $72,203, marked by the centerline of the supply zone between $71,333 and $73,076.
Also Read: Bitcoin price outlook amid increased demand and speculation pre-halving
Ethereum price flirts with a bullish pattern, but there’s a caveat
Ethereum price is trading with a bearish bias, an outlook seen across the market. If Bitcoin price crashes further, ETH could follow, slipping below the bottom of the market range at $2,850. In a dire case, the altcoin could drop to provide another buying opportunity around $2,750.
Like the case for BTC, the RSI, MACD, and AO are also hinting at a further downside potential for Ethereum.
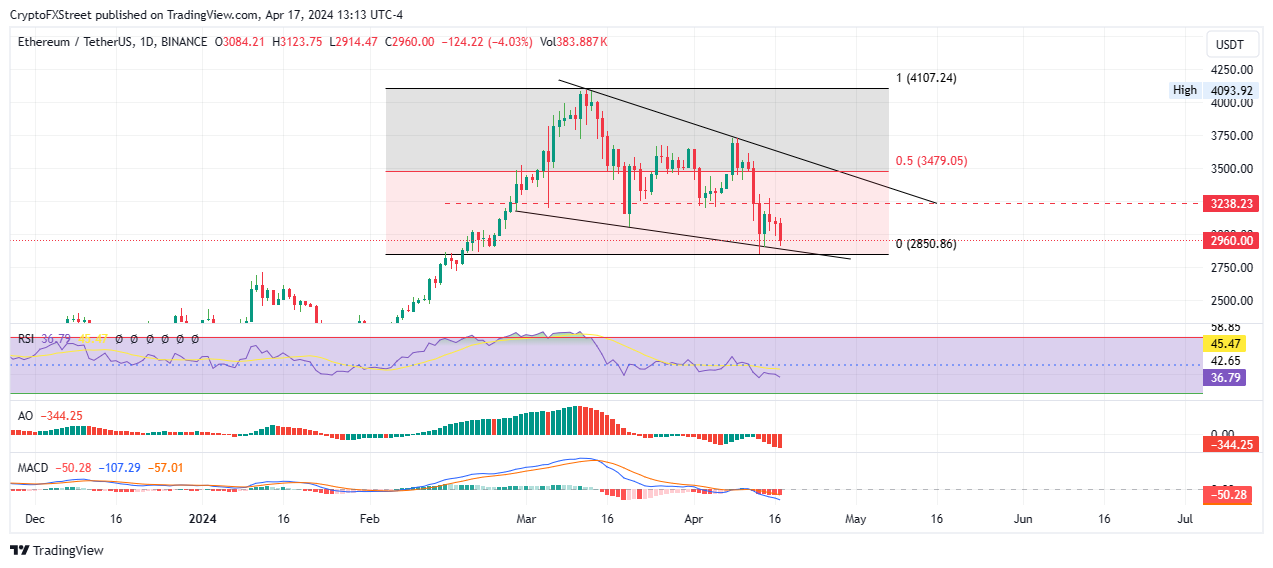
ETH/USDT 1-day chart
On the other hand, the price action of the Proof-of-Stake (PoS) token has a twist as it consolidates within a falling wedge pattern. This pattern is considered bullish, because it usually suggests that the asset's price is likely to break out to the upside as part of a bullish reversal.
The contraction of price volatility could precede a break above 50% Fibonacci placeholder of $3,479 before confronting the resistance trendline. In a highly bullish case, ETH price could go as high as to take back the $4,093 range high.
Also Read: Ethereum continues sideways move as long liquidations slow down
Ripple price suffers growing resistance
Ripple price is withstanding the worst of growing overhead pressure as XRP slides lower. With immediate resistance due to the 200-day Simple Moving Average (SMA) at $0.5007, the payment token’s market value is likely to slide lower. A break and close below the ascending trendline could see XRP price find inflection around $0.4183.
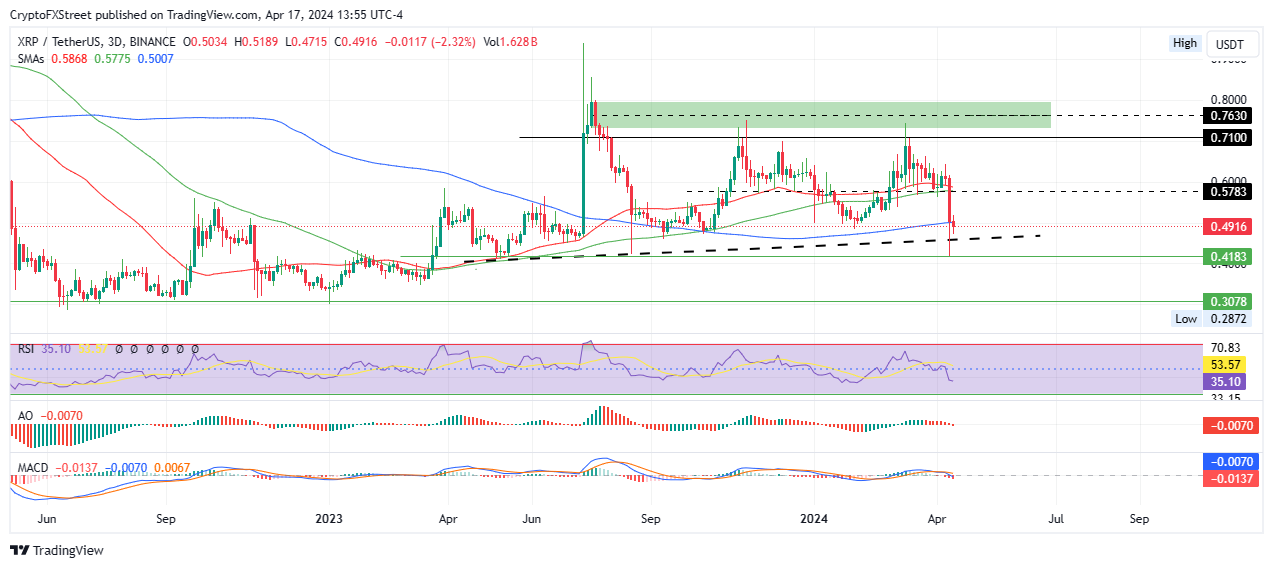
XRP/USDT 3-day chart
On the other hand, if the bulls recover, Ripple price could overcome resistance due to the 200-day SMA, with a move above this blockade sending XRP price all the way to $0.5783. For the bearish thesis to be invalidated, XRP price must close above $0.7100, but confirmation of an uptrend will only happen above $0.7630.
Recommended Articles


