
Pi Coin Holds Gains in a Red Market — Another Breakout At 6.5%?
Pi Coin is one of the few assets holding green while much of the crypto market stays red this month. Bitcoin is down about 20% and Ethereum has dropped nearly 27% month-on-month. Pi Coin price, once seen as a weaker project, is still up almost 18% in the same period.
Even after today’s 5% dip, its monthly trend remains positive. This unusual strength now puts Pi Coin (PI) only 6.5% away from a fresh breakout attempt. Here’s how!
Money Flow Strengthens The Uptrend
The first sign of strength comes from the Money Flow Index (MFI). MFI uses both price and volume to show if buyers or sellers are in control. Pi Coin broke above its MFI trend line on November 16, right as the price started rising.
Since November 14, Pi Coin has climbed almost 26%, and the MFI breakout confirmed that buyers were active early. The indicator has pulled back slightly, but it is still above its trend line. As long as it stays above it, dips are more likely to act as simple pullbacks instead of full reversals.
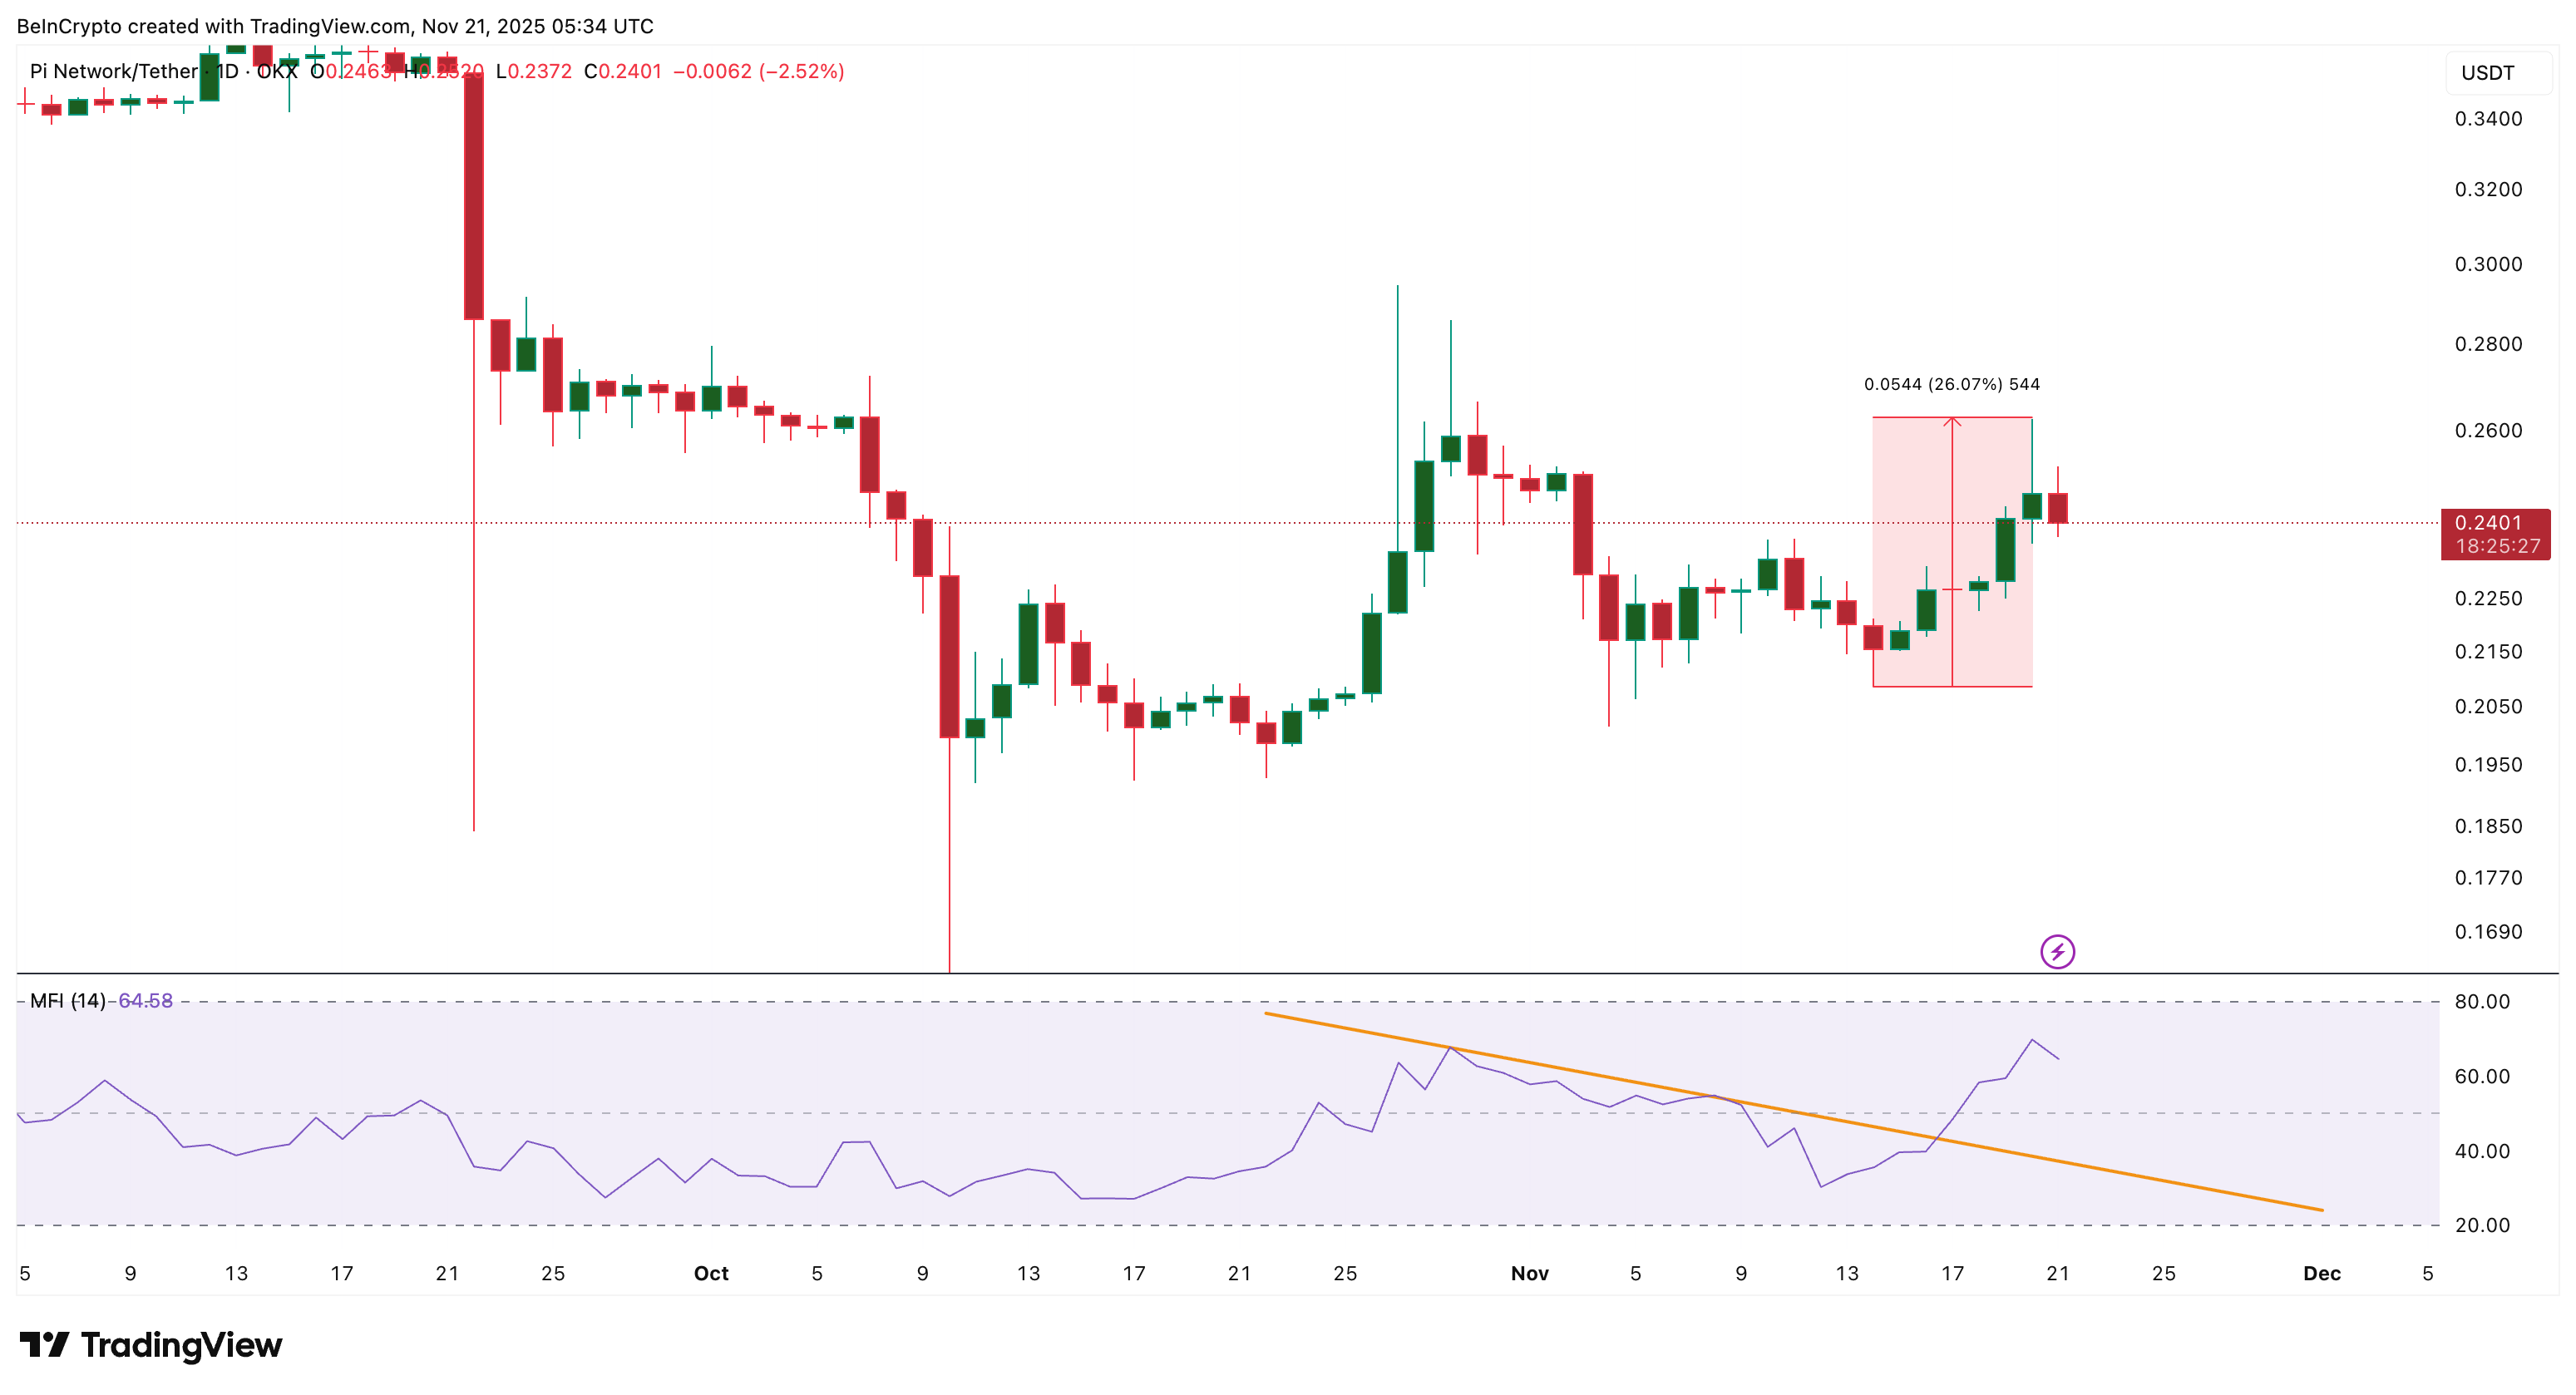 Dip Buying Continues: TradingView
Want more token insights like this? Sign up for Editor Harsh Notariya’s Daily Crypto Newsletter here.
Volume flow supports this idea as well. The On-Balance Volume line (OBV) broke its trend line on November 18, two days after the MFI breakout. OBV tracks whether more volume is flowing into the asset or out of it.
A late OBV breakout usually means smaller traders joined after larger wallets took the first step. OBV is still in negative territory near –1.84 billion, a common feature of downtrends. Do note that the PI price trend still points down in the long term, as it’s down by over 30% in the last three months.
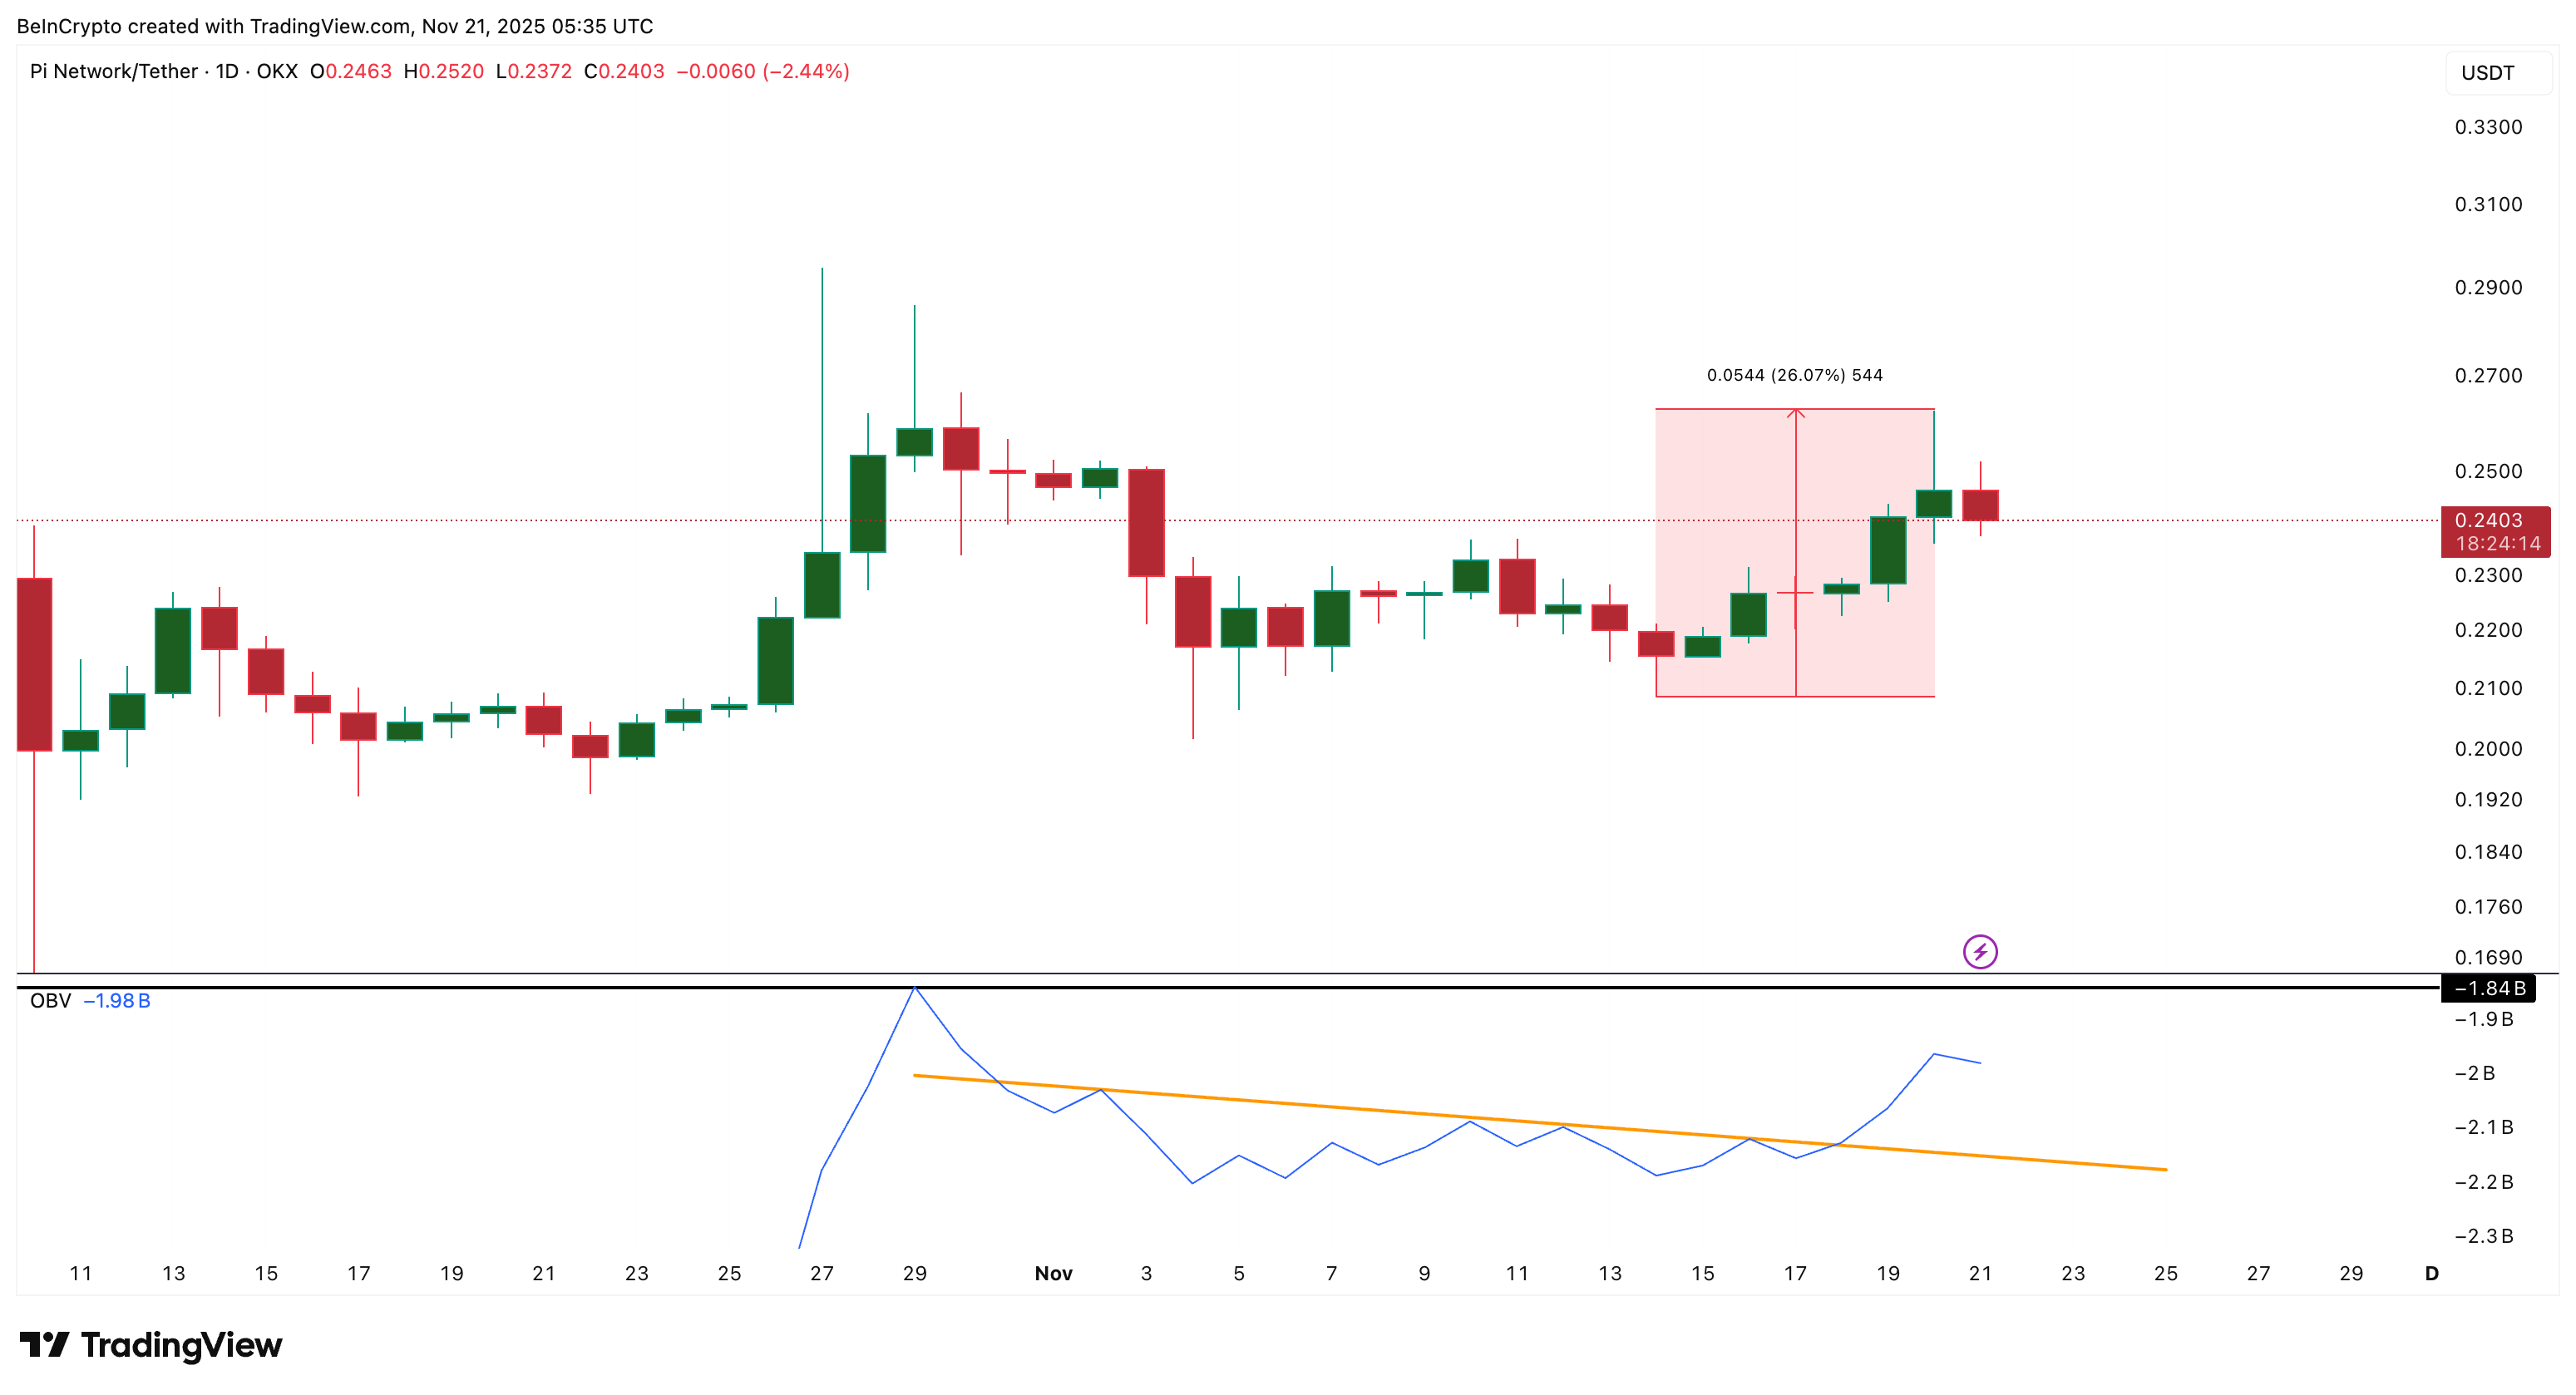 Volume Backs The PI Story: TradingView
The upward OBV slope shows improving demand. Clearing –1.84 billion would strengthen the short-term trend.
A rare detail adds more weight: PI’s seven-day correlation with Bitcoin sits near –0.87. This is the Pearson coefficient, which measures whether two assets move together. A reading close to –1 means they move in opposite directions.
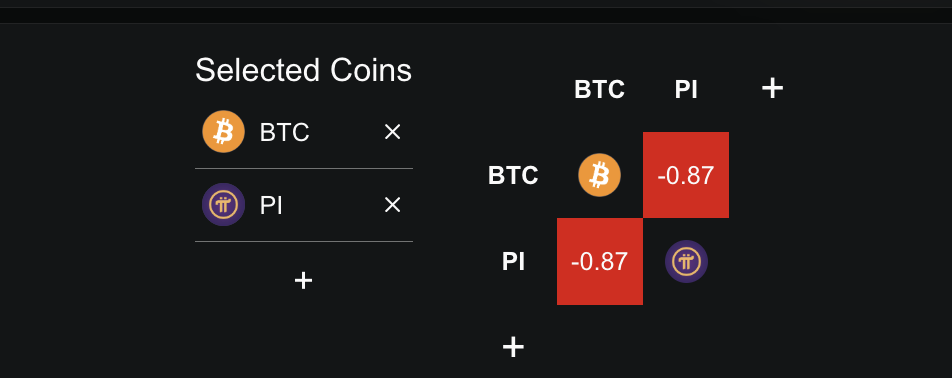 PI-BTC Correlation: Defillama
That explains why Pi Coin has remained green while Bitcoin and other large caps fell. If BTC continues to correct, the Pi Coin price might see more upside, per this theory.
An Upcoming Crossover Builds a Bullish Case
The 4-hour chart adds to the bullish argument. Pi Coin trades above all major exponential moving averages. The 50-period average is moving closer to the 200-period average.
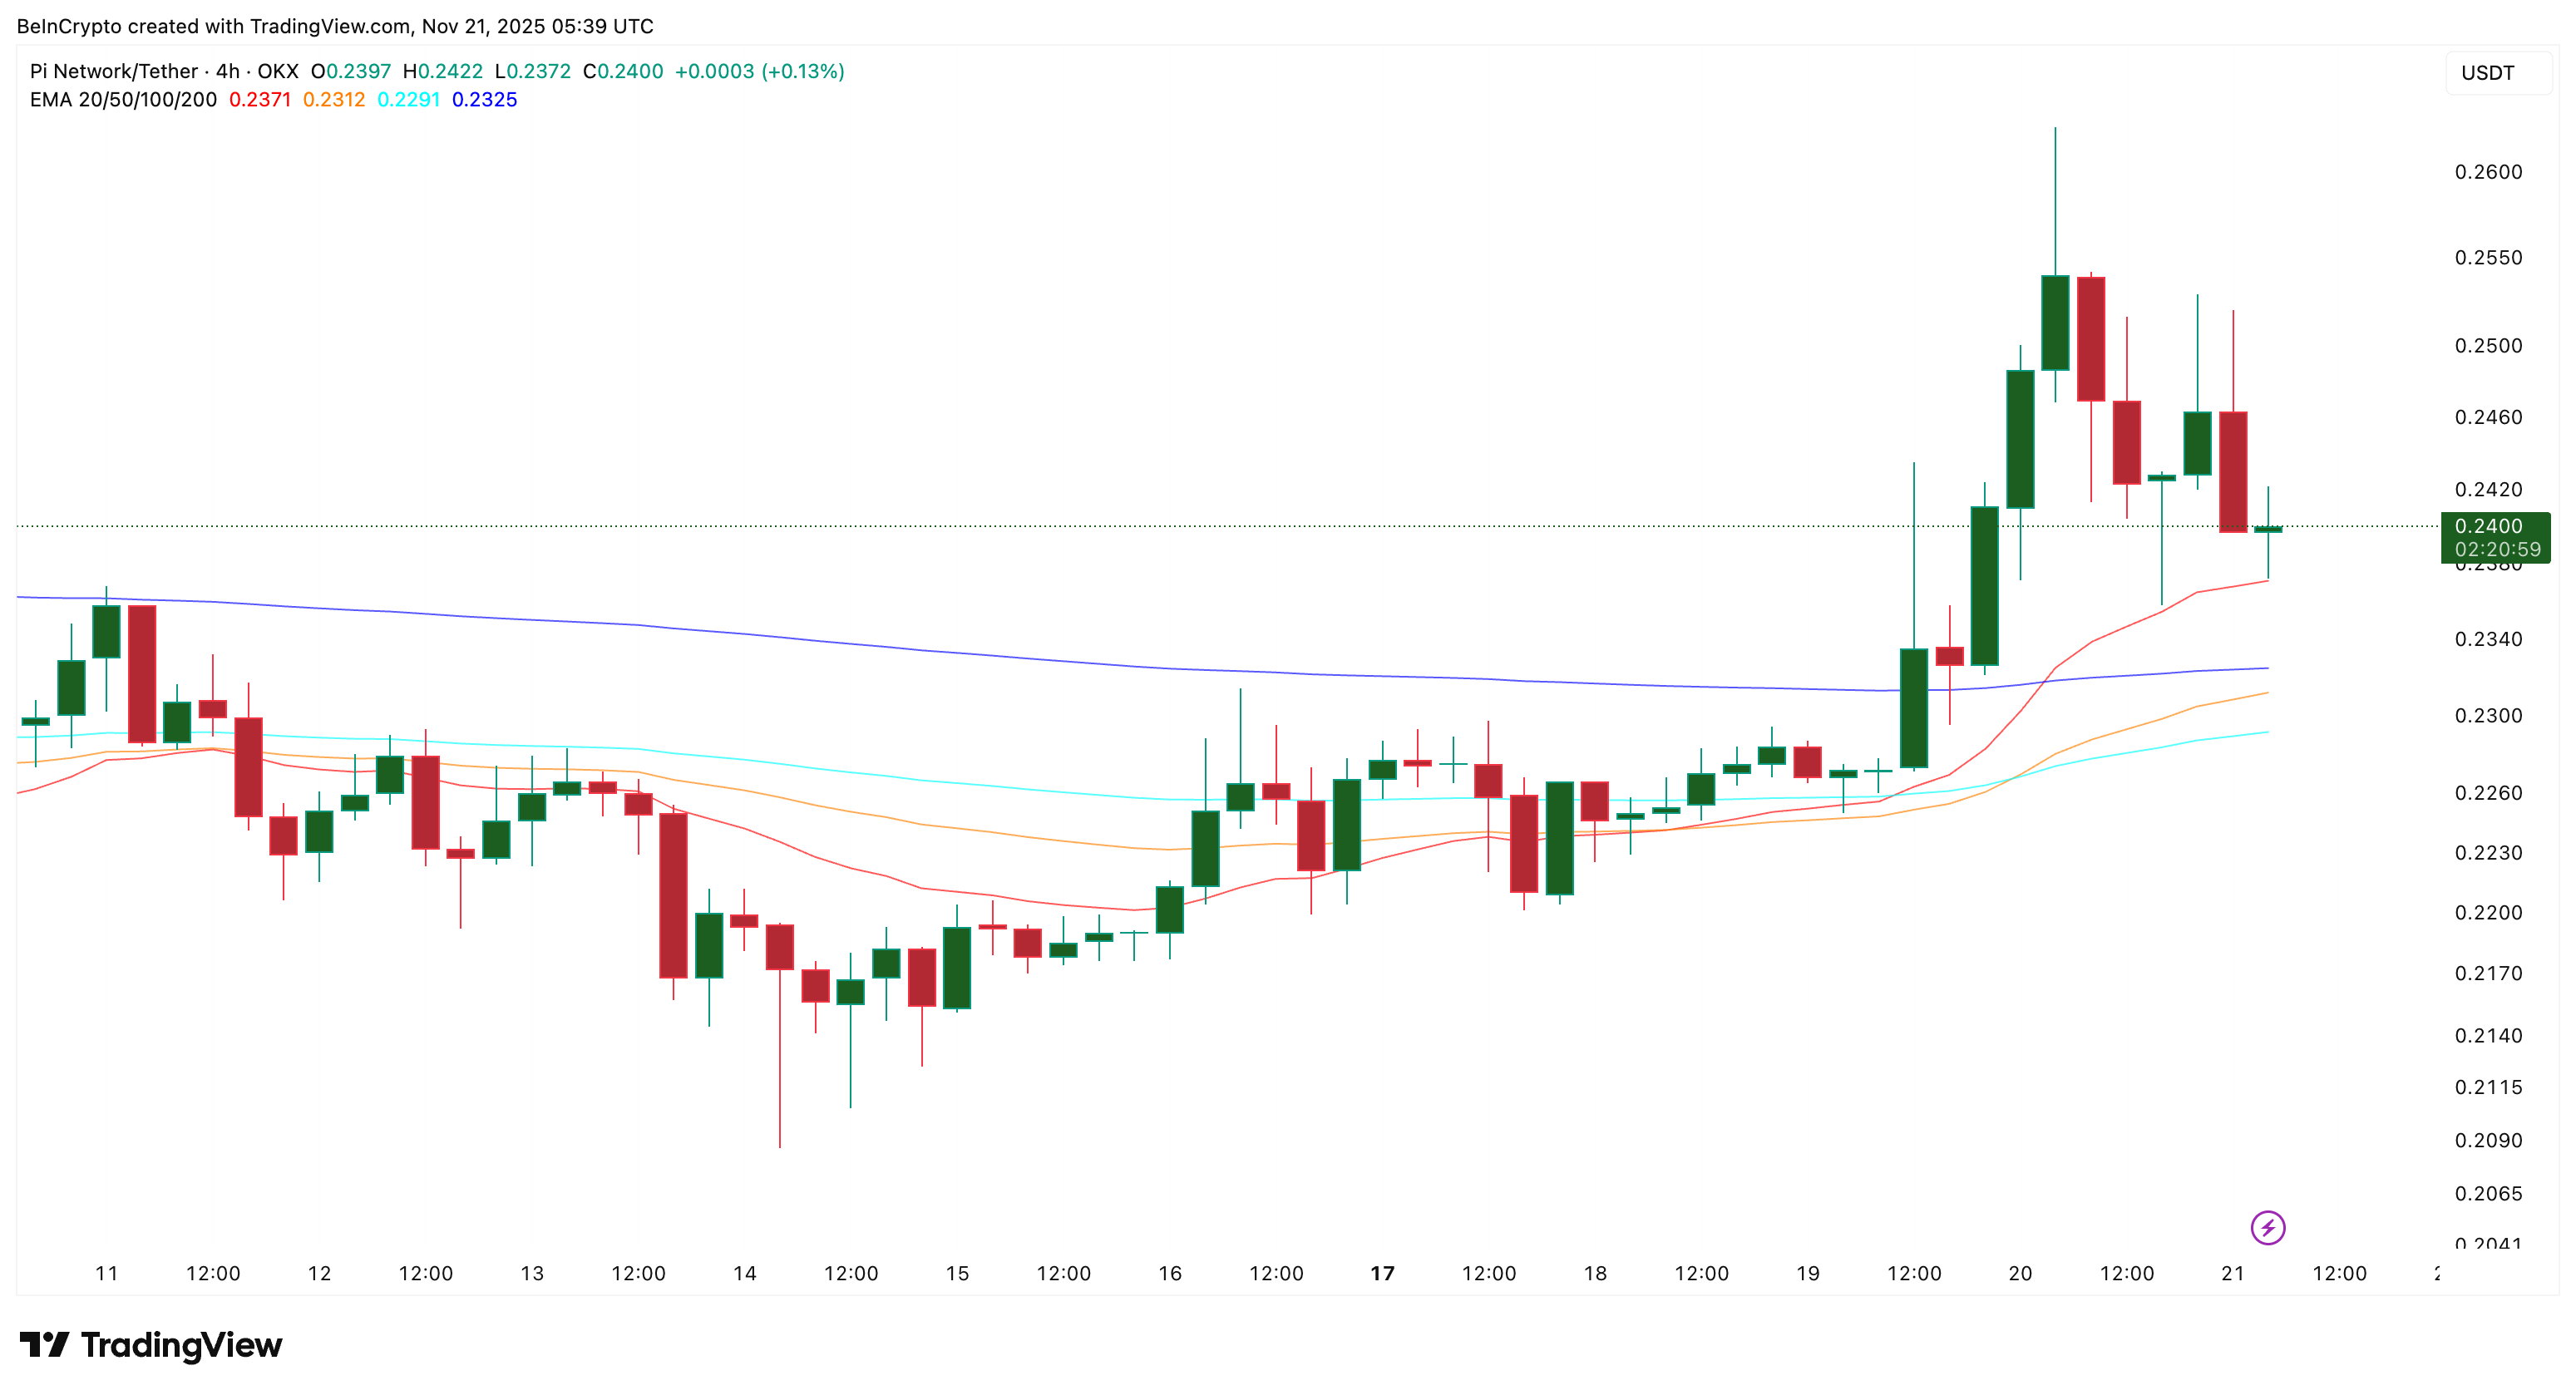 Pi Coin Could Extend Gains In The Short-Term: TradingView
If the 50 crosses above the 200, the structure forms what traders call a golden crossover. It usually means short-term strength is catching up to long-term trend direction. This setup supports the idea that Pi Coin’s uptrend still has room.
Exponential moving average (EMA) gives more weight to recent price data, so it reacts faster than simple moving averages.
Pi Coin Price Levels to Watch
Trend-based Fibonacci extensions show the next resistance near $0.25. Pi Coin needs a clean daily close above this level to unlock the next wave higher. That requires a move of roughly 6.5% from the current price. Crossing $0.25 might allow Pi Coin’s rally to extend higher, with even $0.31 and $0.34 in contention.
On the downside, the key support sits near $0.23. Losing it on a daily close increases the risk of a drop toward $0.20, which would wipe out most of Pi Coin’s recent gains.
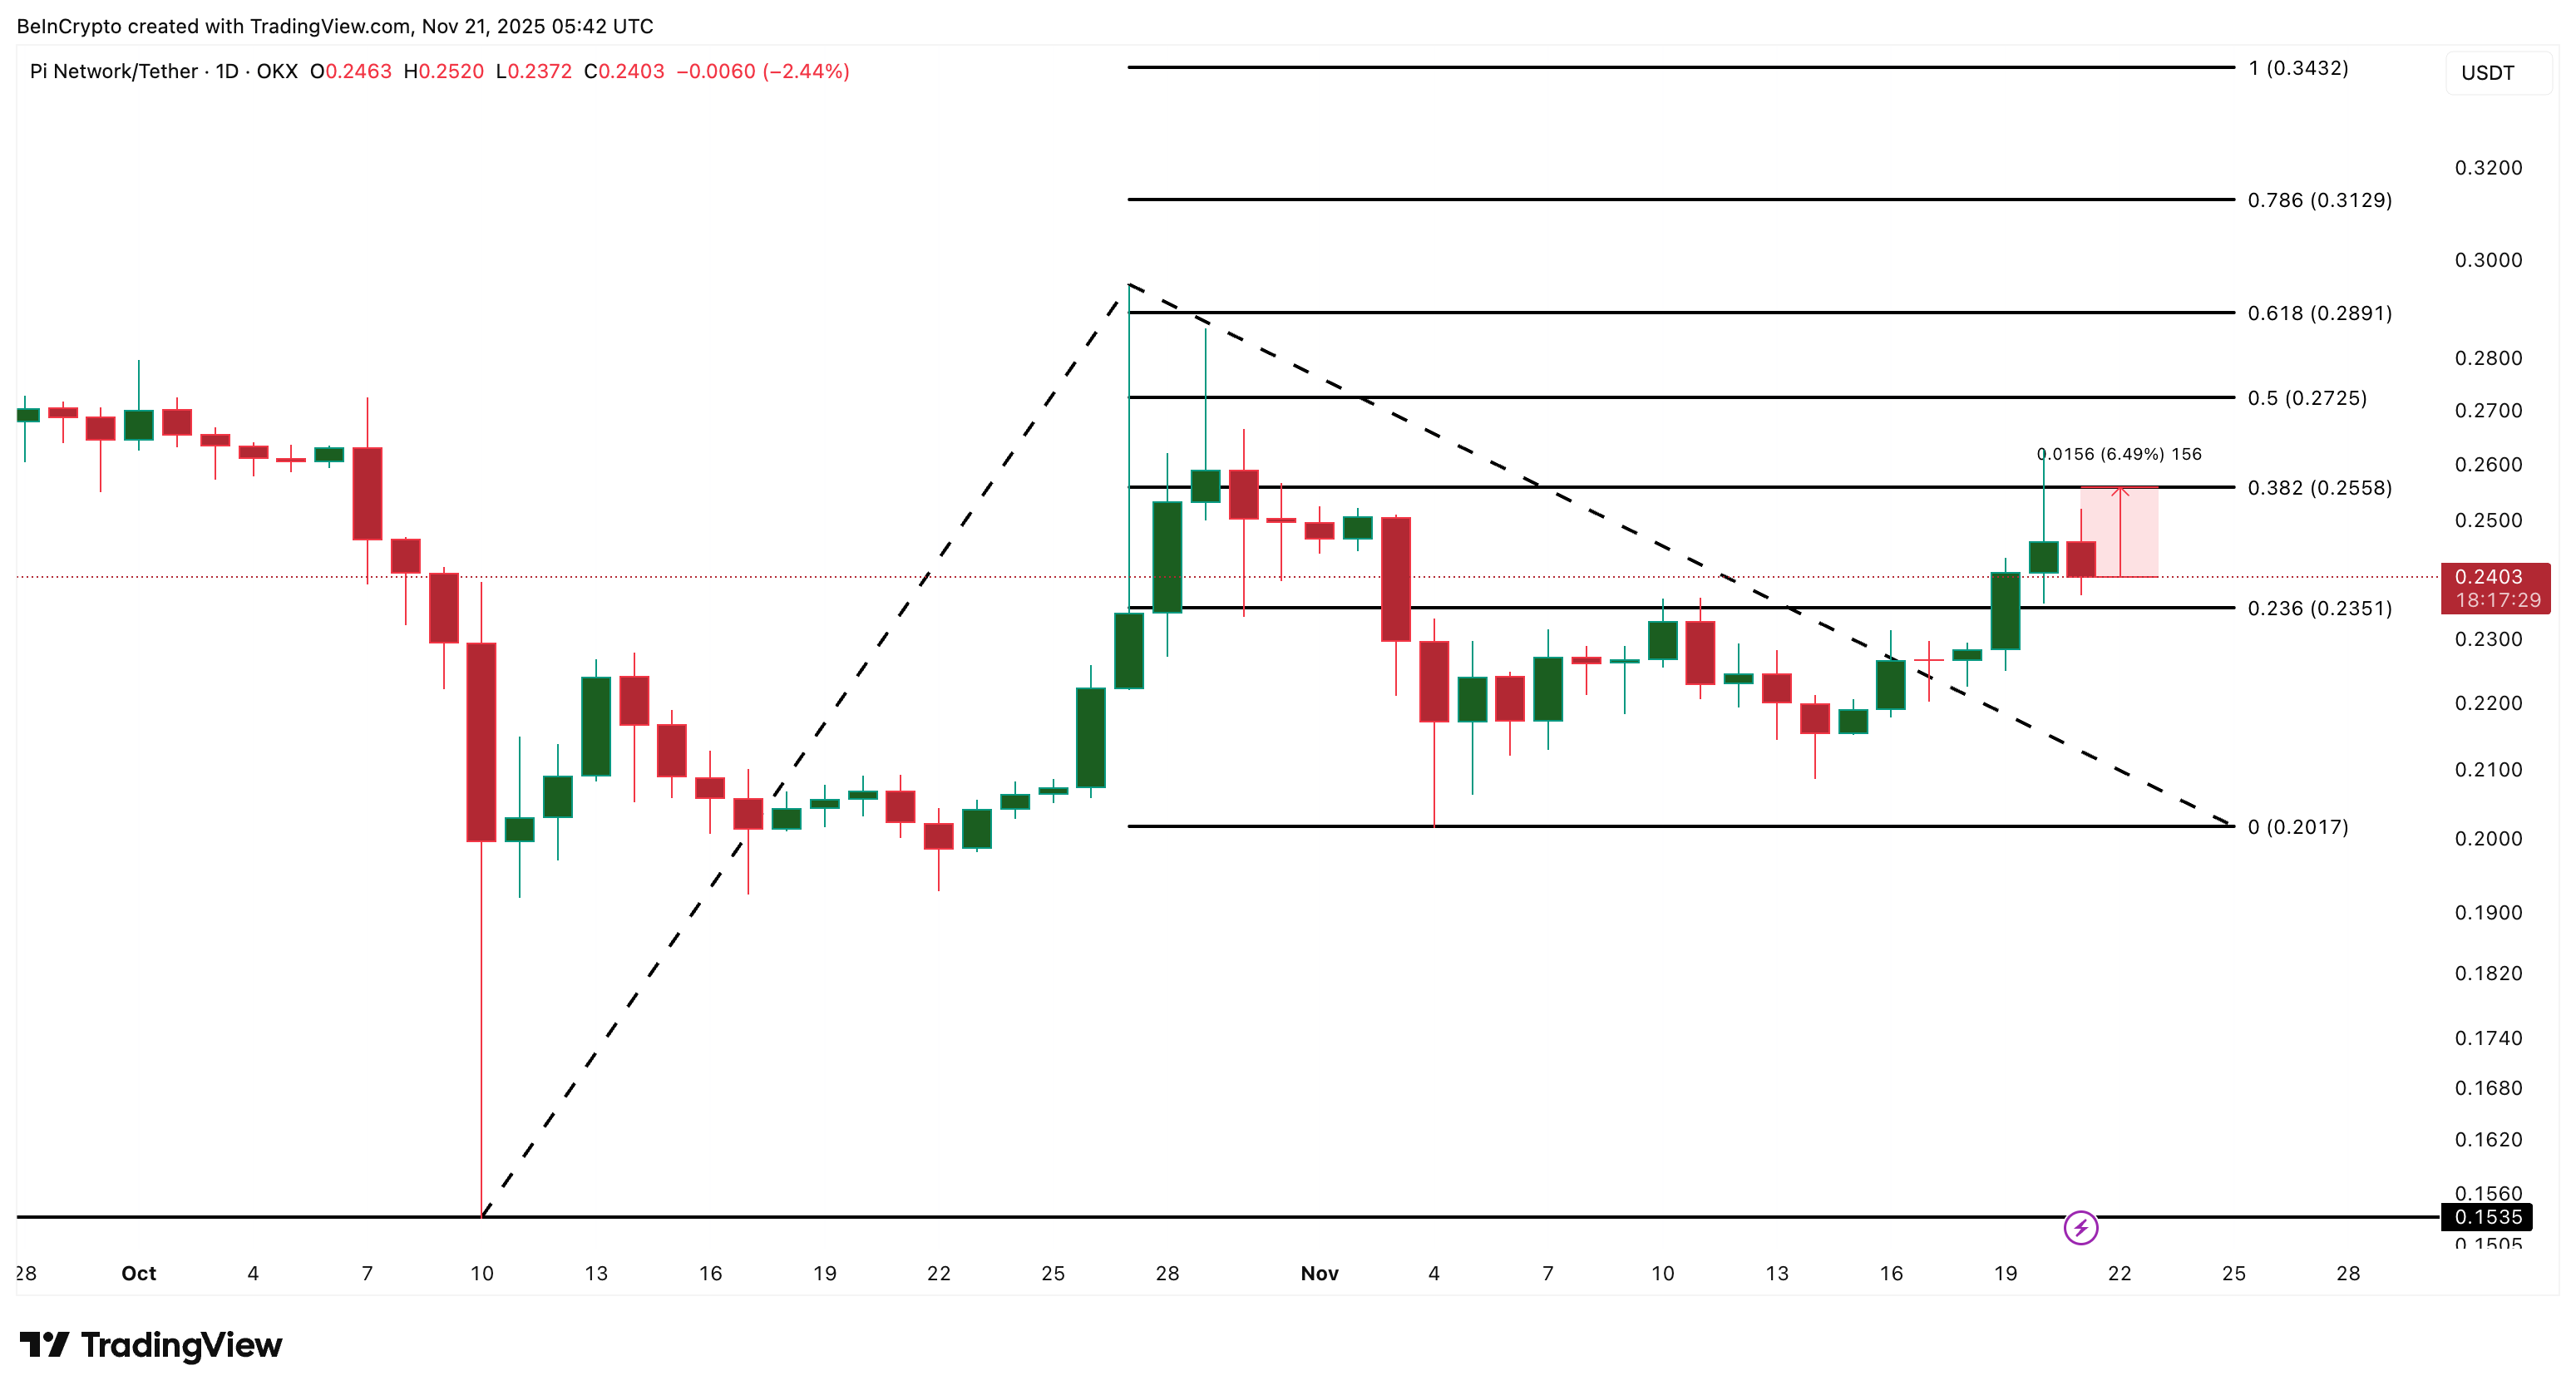 Pi Coin Price Analysis: TradingView
For now, Pi Coin remains one of the rare green assets in a red market, on a monthly timeframe. If buyers can push it 6.5% higher, another breakout attempt may be just ahead.
Recommended Articles


