

Cronos Price Prediction: CRO nears wedge pattern playout, bulls in focus
- Cronos holds above $0.10 psychological level, nearing the apex of a falling wedge pattern.
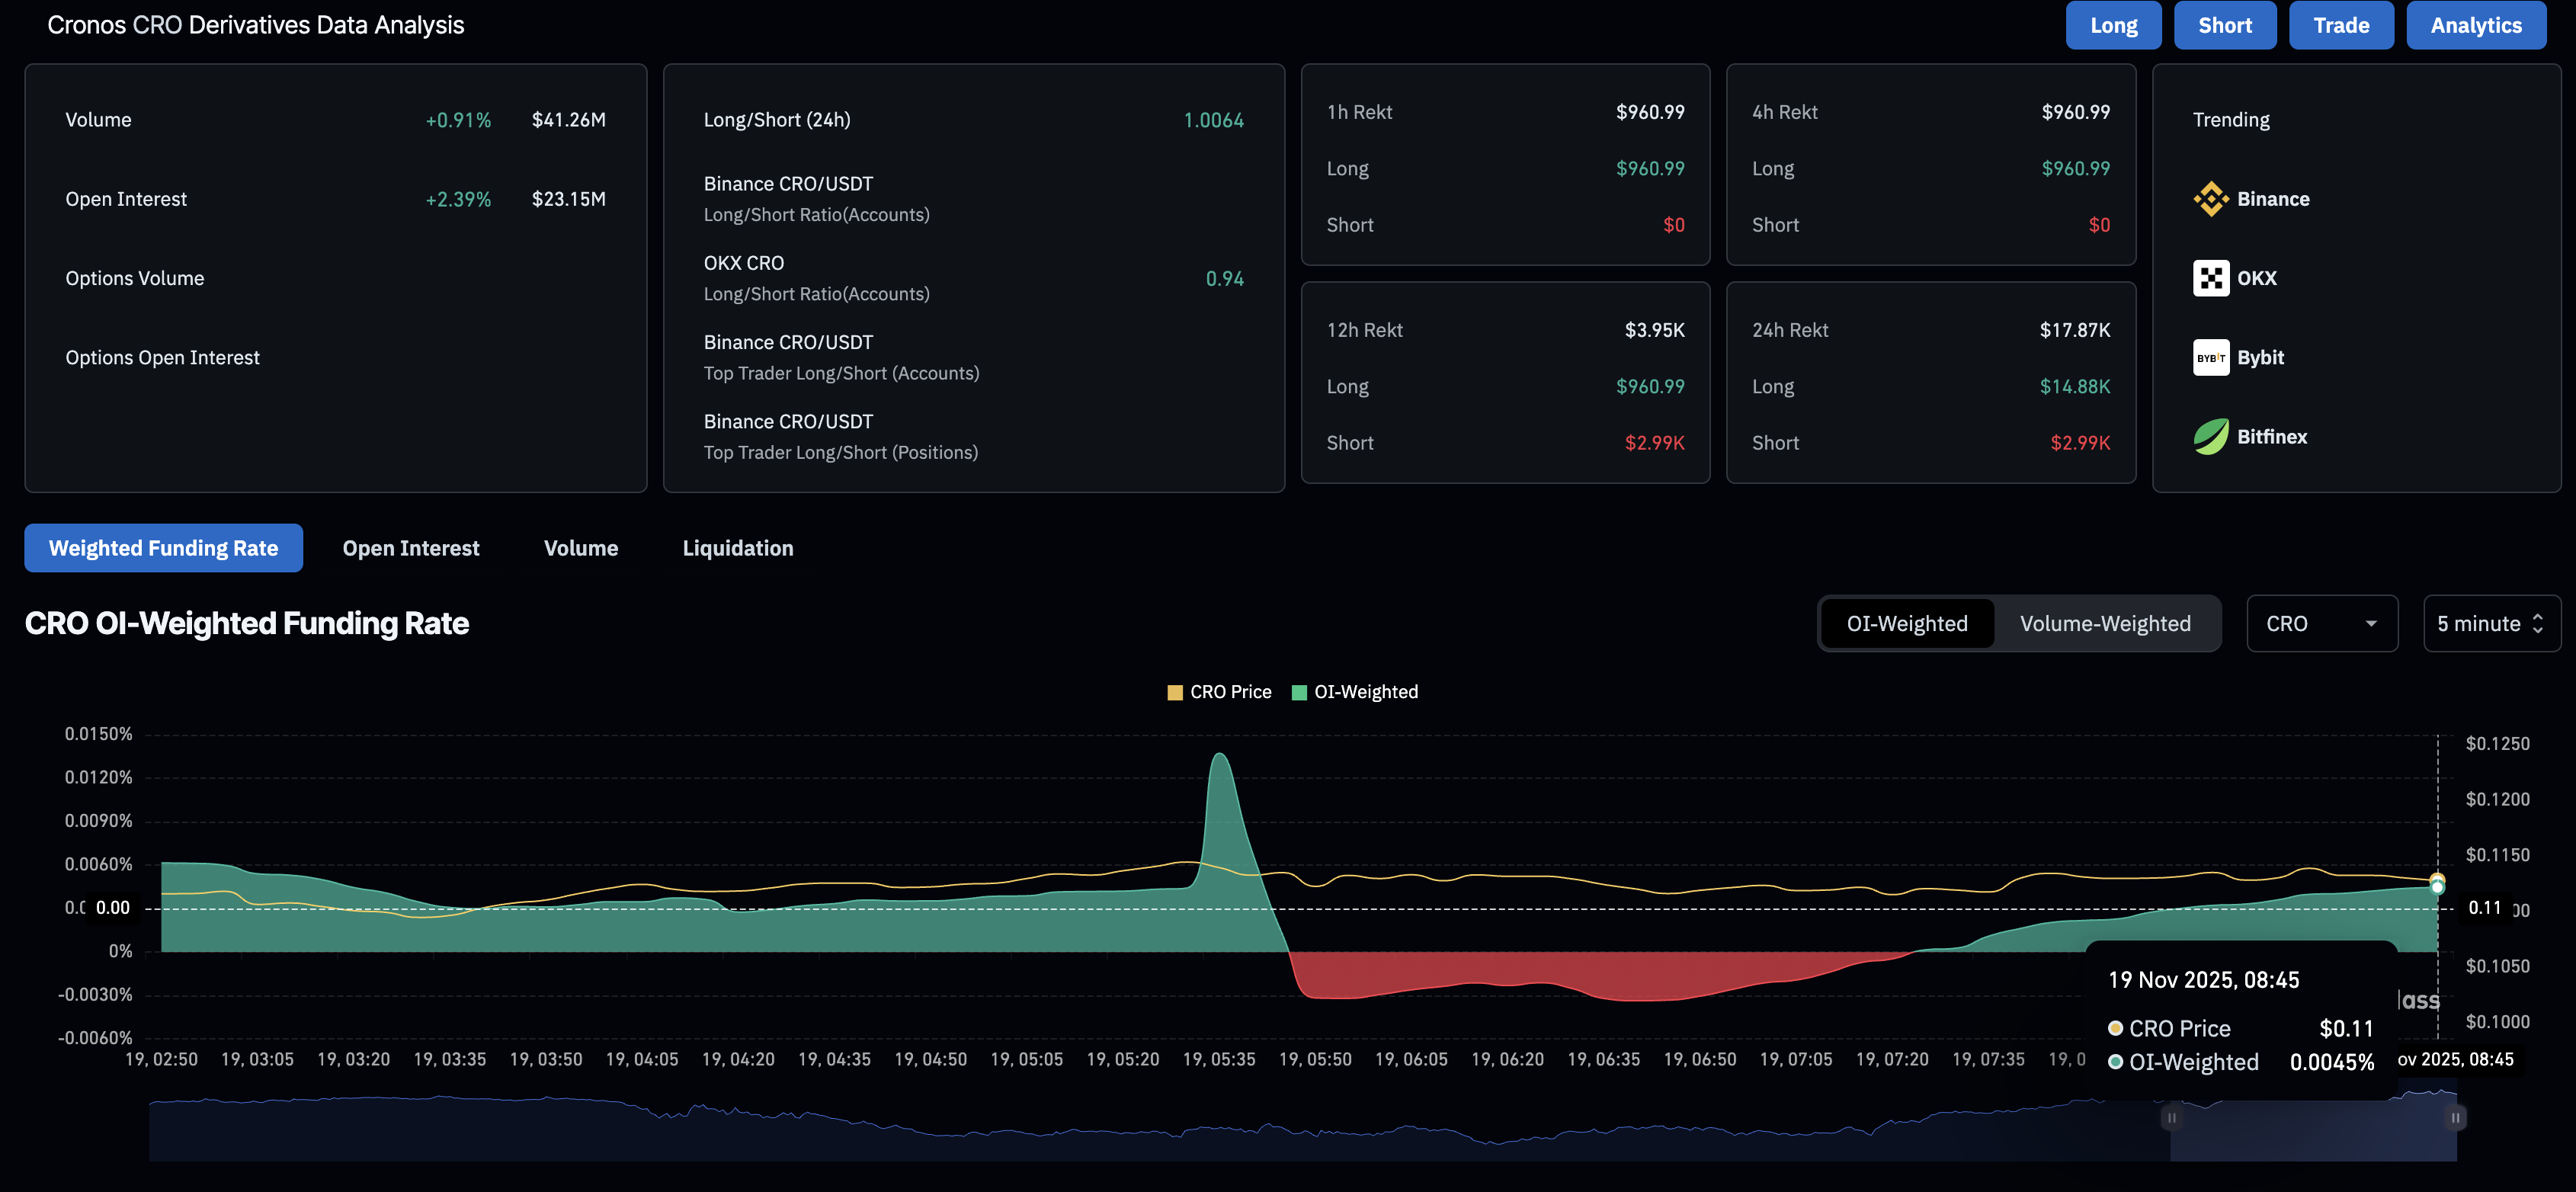
- Derivatives data suggests a risk-on sentiment surge among CRO traders, as Open Interest and funding rates rise.
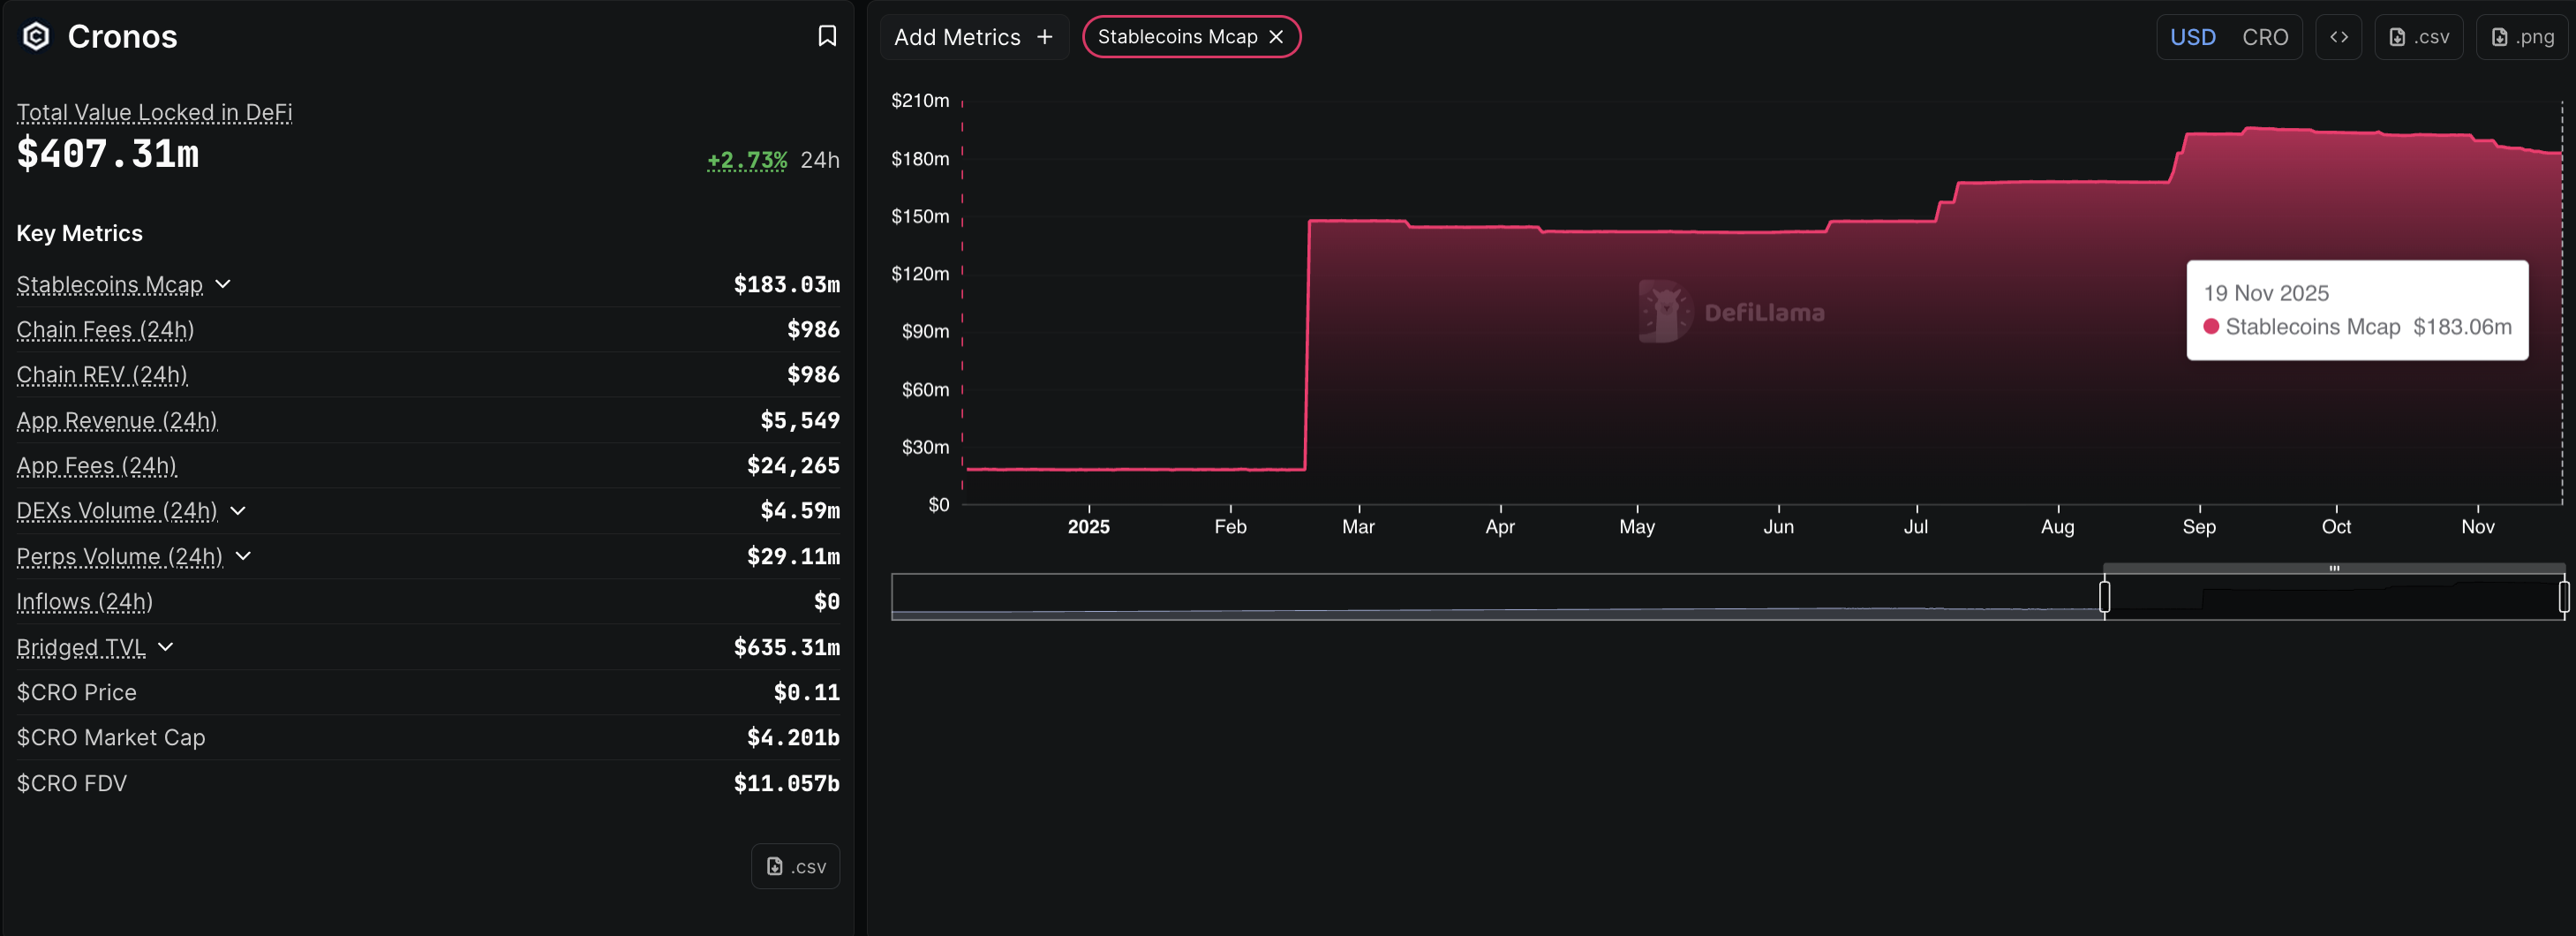
- DeFiLlama data indicates a surge in TVL on Cronos while liquidity remains strong.
Cronos (CRO) ticks lower by 3% at press time on Wednesday, retreating after a 10% surge from the previous day. The short-term fluctuations approach the apex of a falling wedge pattern, which typically results in an upside breakout.
Derivatives data suggest an increase in bullish anticipation among traders, with long positions rising. At the same time, an increase in Total Value Locked (TVL) on the Cronos blockchain reflects growing confidence among on-chain users.
On-chain and derivatives sentiment regain strength
Cronos' demand is heating up in the retail segment as traders anticipate a price bounce for the CRO token. CoinGlass data shows a 2.39% increase in CRO futures Open Interest over the last 24 hours, standing at $23.51 million. This indicates a build-up of long positions as Cronos prepares for a potential breakout rally.
In line with increased demand, the OI-weighted funding rate of 0.0045% indicates the market is willing to bear the interest for holding long positions, which is imposed to offset the imbalance between spot and swap prices caused by available leverage.
Alongside retail demand, on-chain adoption of Cronos is picking up, with DeFiLlama data showing a 2.73% increase in Cronos' TVL to $407.31 million. This inflow of digital assets into Cronos reflects growing confidence among on-chain users, while the stablecoin market capitalization remains above $183 million, up from $18.39 million on January 1, suggesting strong liquidity.
Cronos hits the final crossroads within a falling wedge pattern
Cronos approaches the apex of a falling wedge pattern, a price pattern formed by a declining price trend in a bottleneck shape defined by two descending trendlines, on the daily chart. Typically, the falling wedge foreshadows a bullish rebound as sellers lose strength.
Corroborating the breakout rally possibility, the Moving Average Convergence Divergence (MACD) reverses to hit the signal line, hinting at a possible crossover. If this happens, the indicator will flash a buy signal based on renewed bullish momentum.
At the same time, the Relative Strength Index (RSI) at 36 bounces off the oversold boundary, indicating a fresh wave of buying.
However, the 50-day Exponential Moving Average (EMA) crossed below the 200-day EMA on Sunday, flashing a Death Cross pattern, which signals that the prevailing bearish trend in the wedge is gaining strength. If the declining trend in moving averages results in a similar crossover of the 100- and 200-day EMAs, it would flash a sell signal, risking the collapse of the falling wedge pattern.
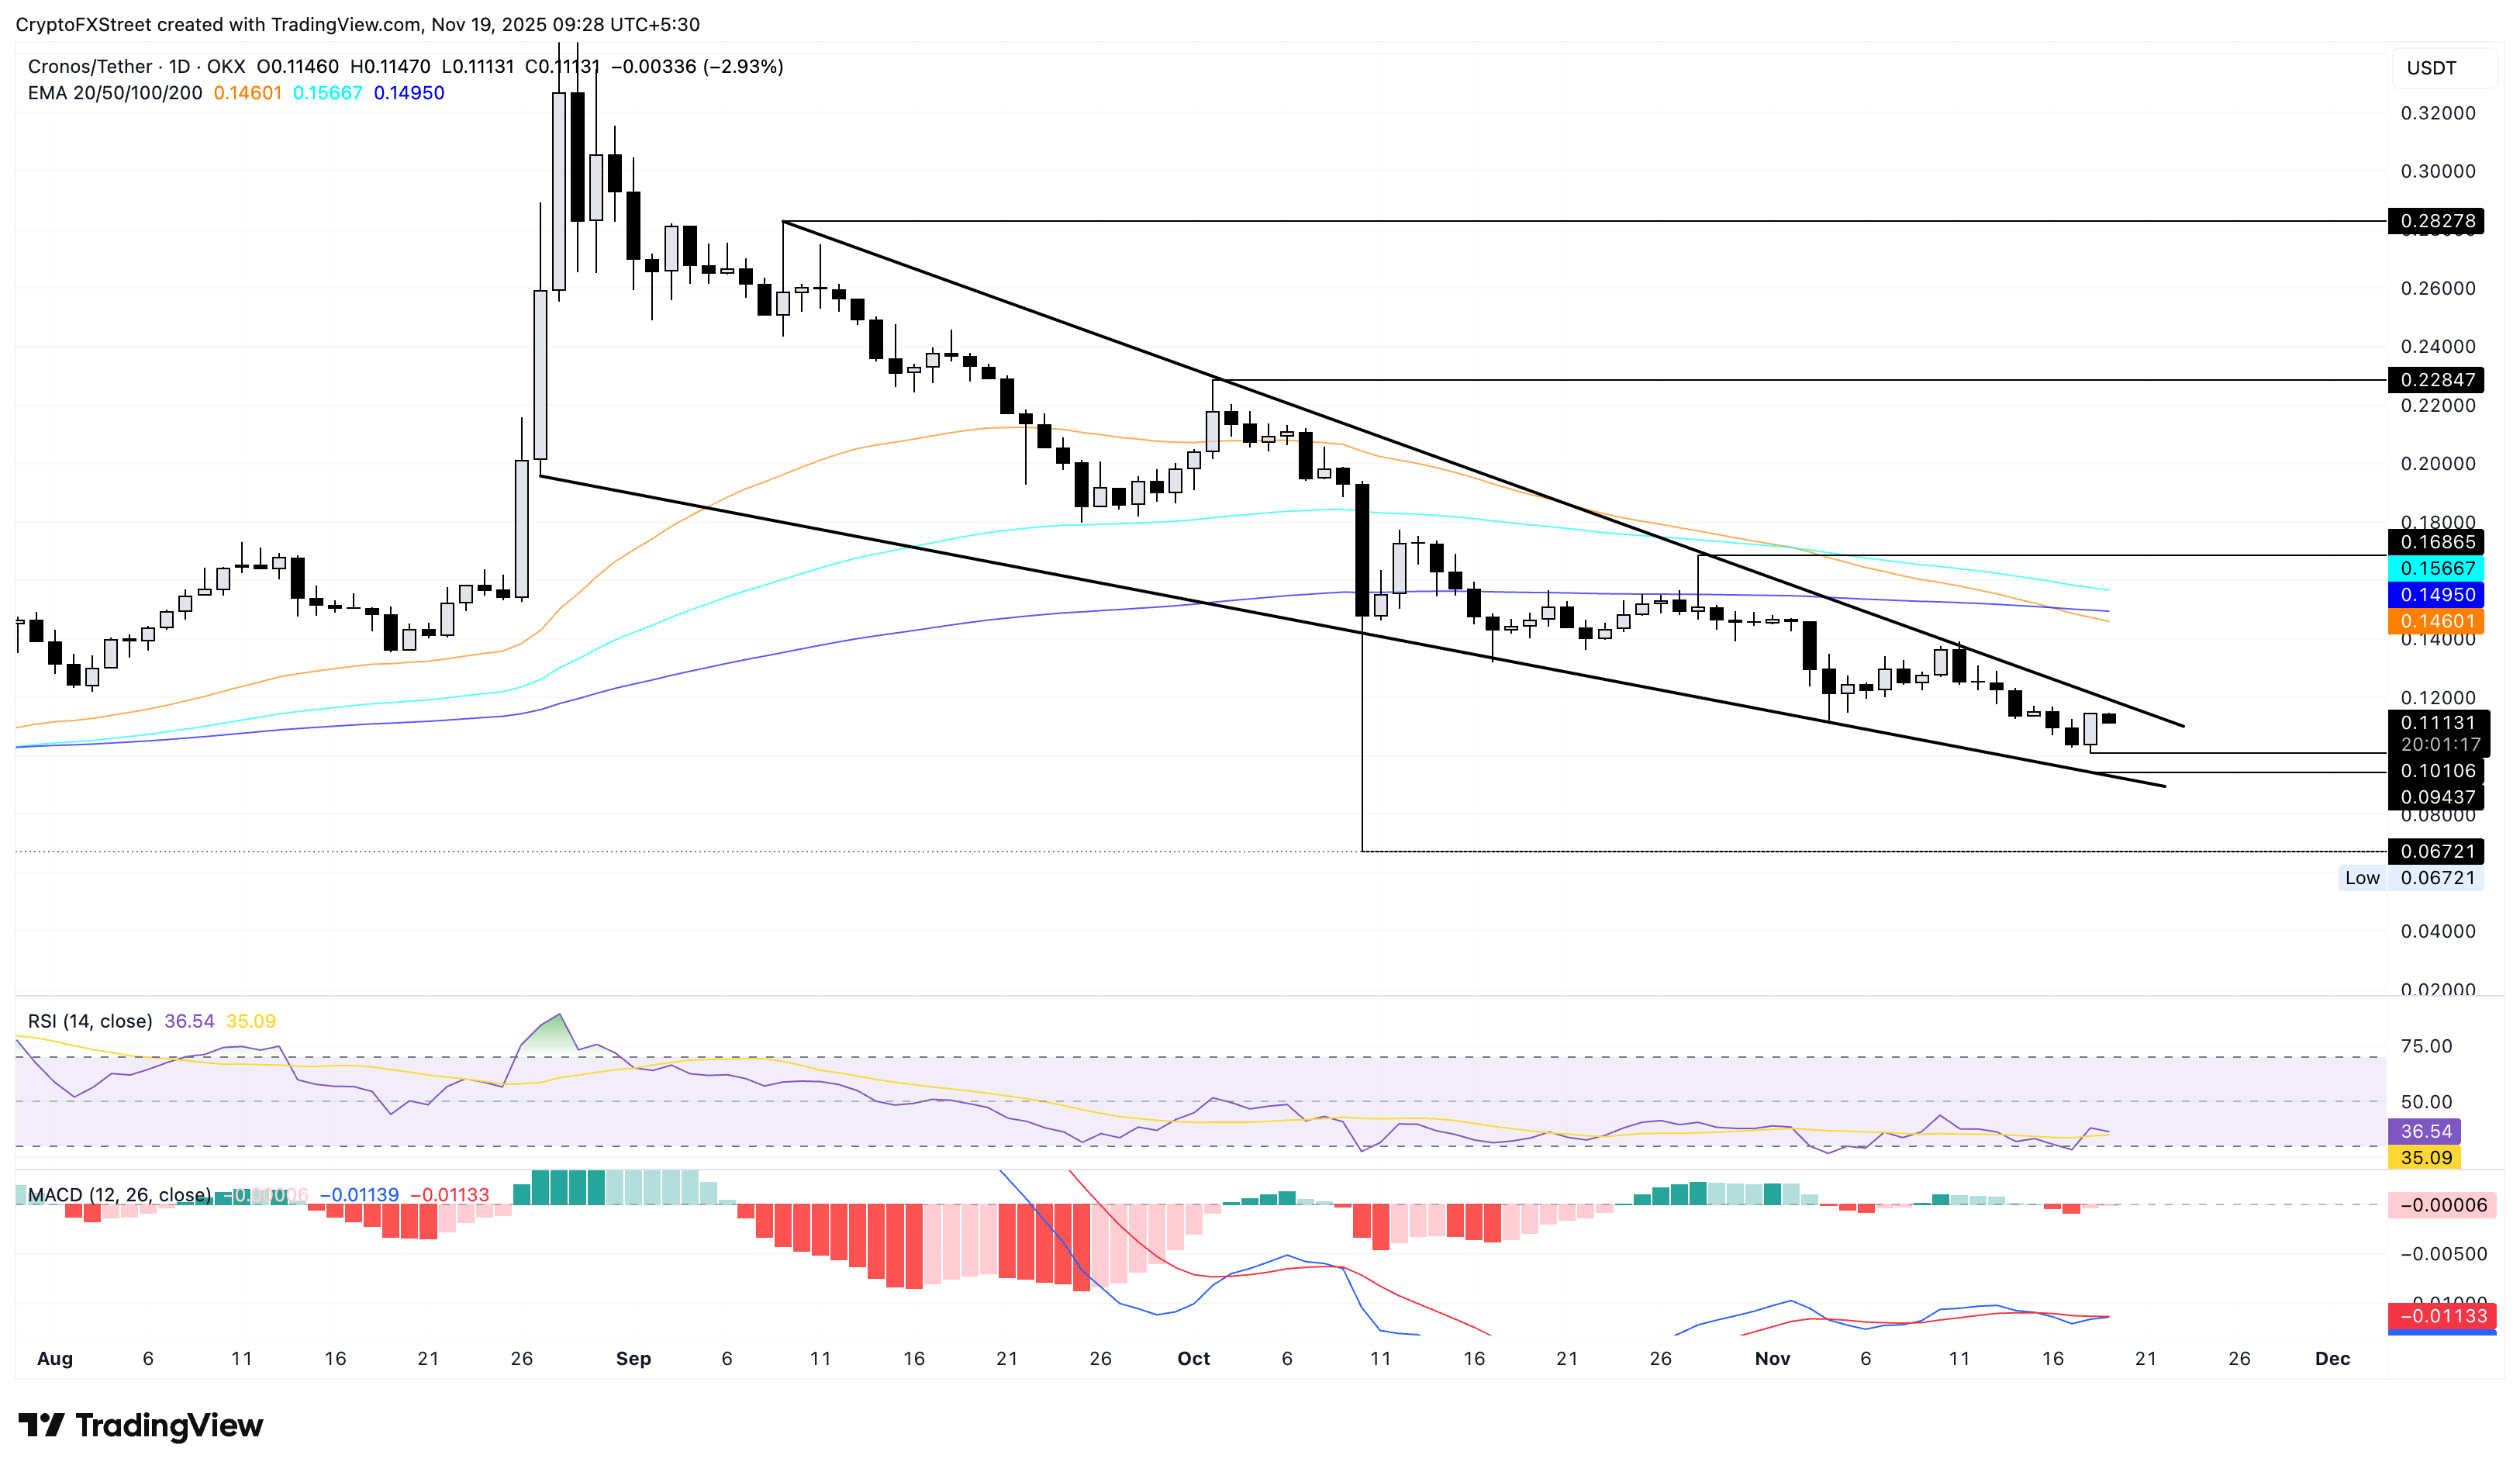
To nullify the wedge pattern, CRO should fall below the lower support trendline near $0.09437, potentially extending the downfall to the $0.06721 low from October 10.
Recommended Articles


