
Maple Finance Price Forecast: SYRUP extends gains as monthly revenue surpasses $2 million in October
- SYRUP extends its gains on Thursday, rallying nearly 9% so far this week.
- Maple Finance's monthly revenue hit a new monthly high of $2.15 million in October, signaling growing ecosystem activity.
- The technical outlook suggests further upside if SYRUP closes above the $0.43 resistance level.
Maple Finance (SYRUP) price extends its gains, trading above $0.42 at the time of writing on Thursday after rallying nearly 9% so far this week. The protocol’s revenue surpassing $2 million in October underscores accelerating ecosystem growth and rising investor confidence, hinting at further upside potential if bullish momentum continues.
Maple Finance's revenue hits a new monthly high
Maple Finance posted on its official X account on Wednesday that its monthly revenue has reached a new monthly high of $2.15 so far this month.
Maple Finance further explained that “it has achieved its year-end revenue and AUM targets with two months to spare, and we're not slowing down.”
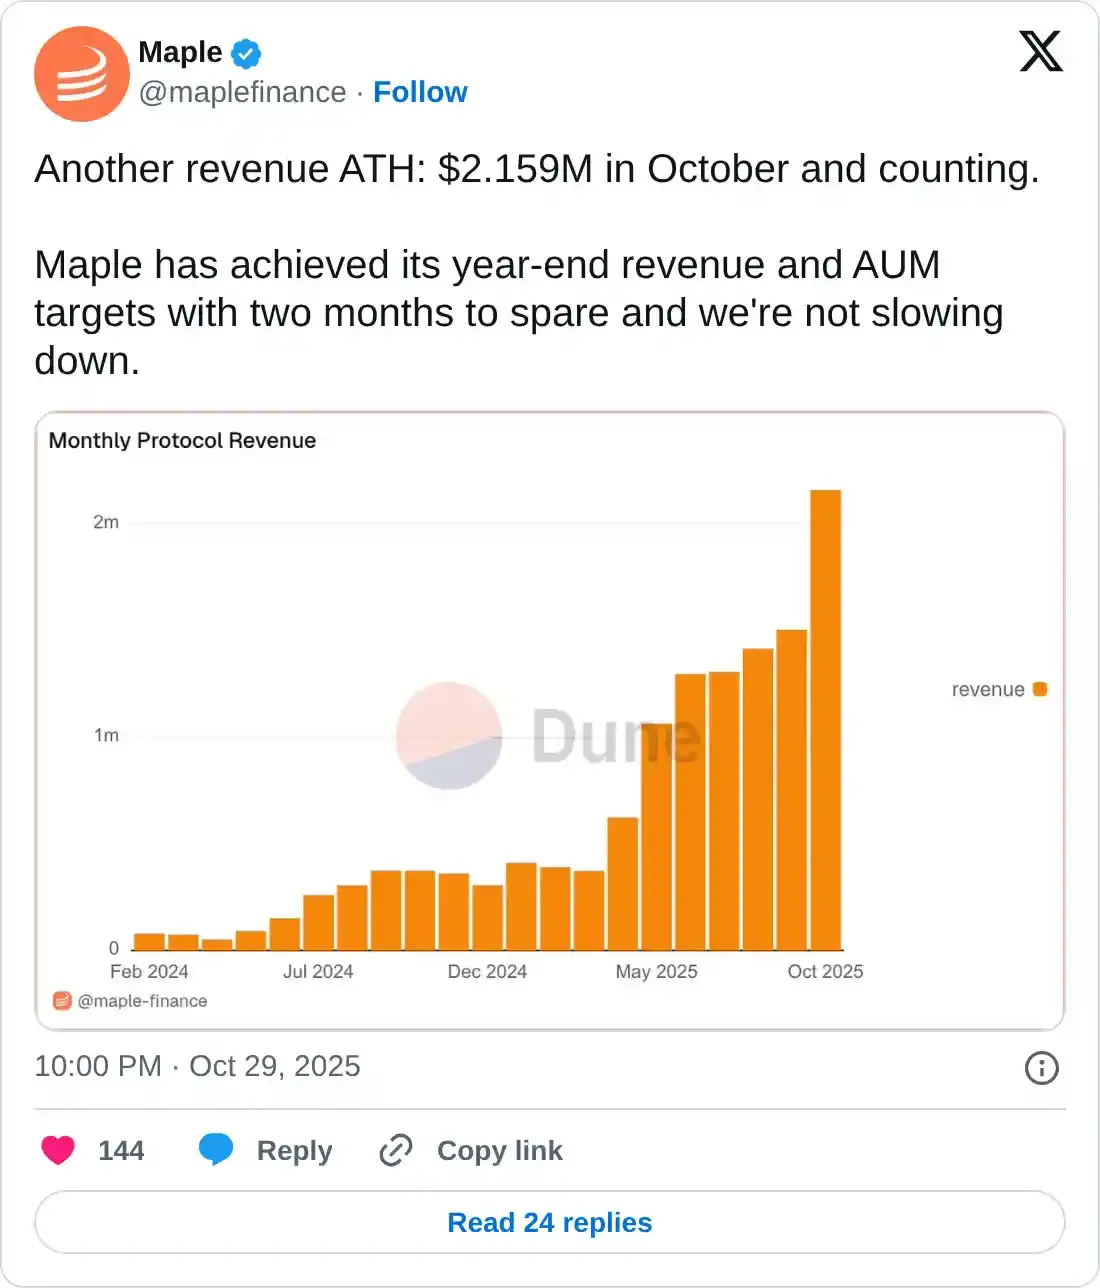
This growing revenue highlights Maple Finance’s accelerating ecosystem growth and increasing demand for its on-chain products.
Maple Finance’s on-chain and derivatives data show a bullish bias
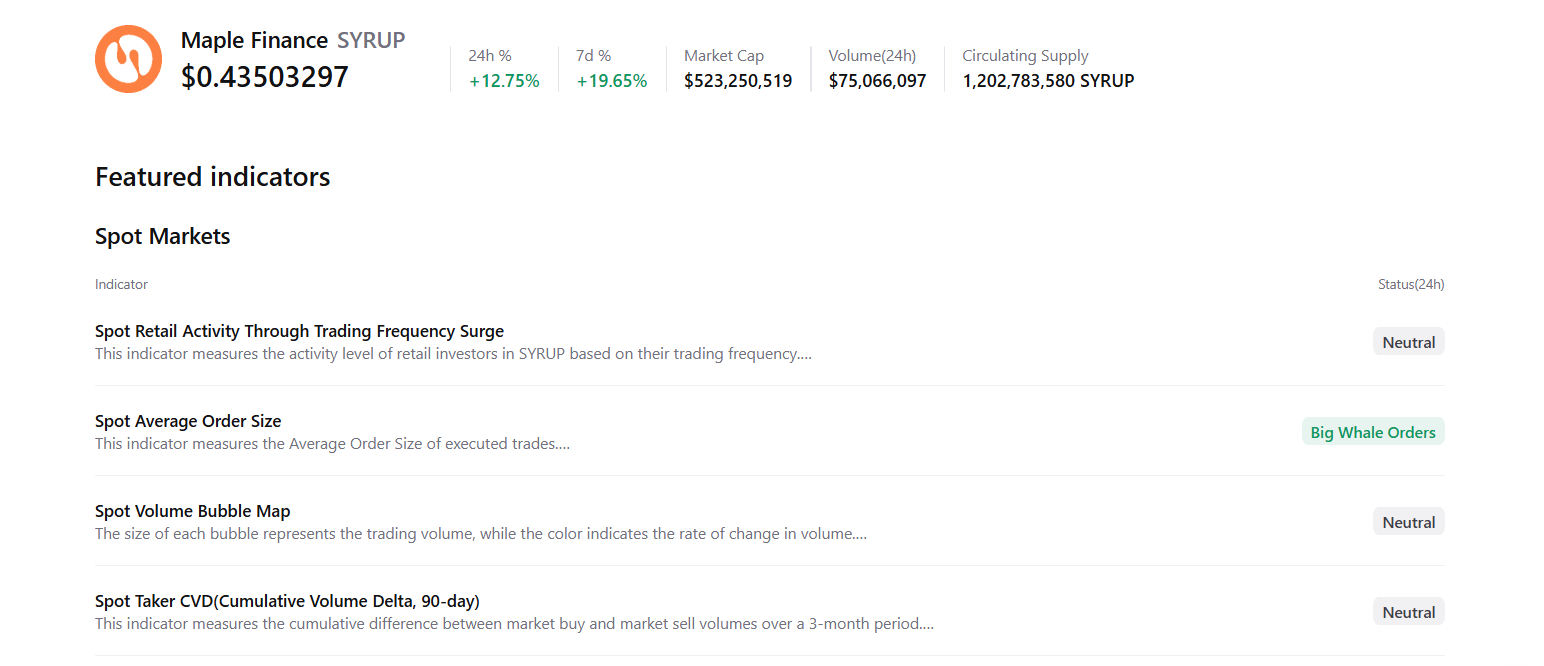
CryptoQuant’s summary data supports the bullish outlook, as SYRUP’s spot markets show large whale orders, signaling a potential rally ahead.
Futures’ OI in SYRUP at exchanges rose from $23.23 million on Tuesday to $32.13 million on Thursday, the highest level since mid-October and has been consistently rising. Rising OI represents new or additional money entering the market and new buying, which could fuel the current SYRUP price rally.
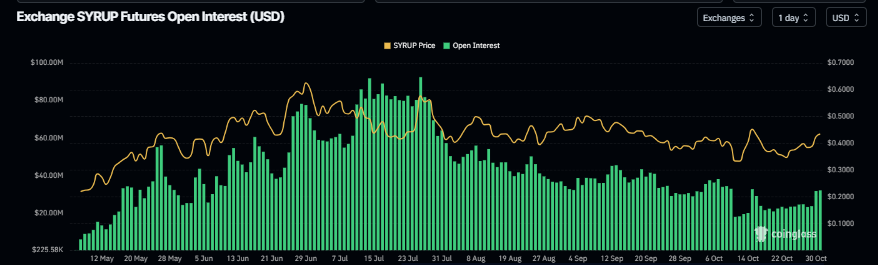
SYRUP’s open interest chart. Source: Coinglass
Maple Finance Price Forecast: SYRUP bulls aiming for higher leg
Maple Finance price rallied 9.35% and closed above the daily resistance at $0.39 and the 50-day Exponential Moving Average (EMA) at $0.40 on Wednesday. At the time of writing on Thursday, it continues to trade higher at around $0.42.
If SYRUP breaks and closes above the 61.8% Fibonacci retracement level at $0.43 (drawn from the July high of $0.68 to the October low of $0.04) on a daily basis, it could extend the rally toward the September 6 high of $0.53. A successful close above this level could extend the gains toward the July 25 high of $0.68.
The Relative Strength Index (RSI) on the daily chart reads 58, above the neutral level of 50, indicating bullish momentum gaining traction. Additionally, the Moving Average Convergence Divergence (MACD) showed a bullish crossover last week, providing a buy signal. Moreover, the rising green histogram bars above the neutral level support bullish momentum and suggest an upward trend.
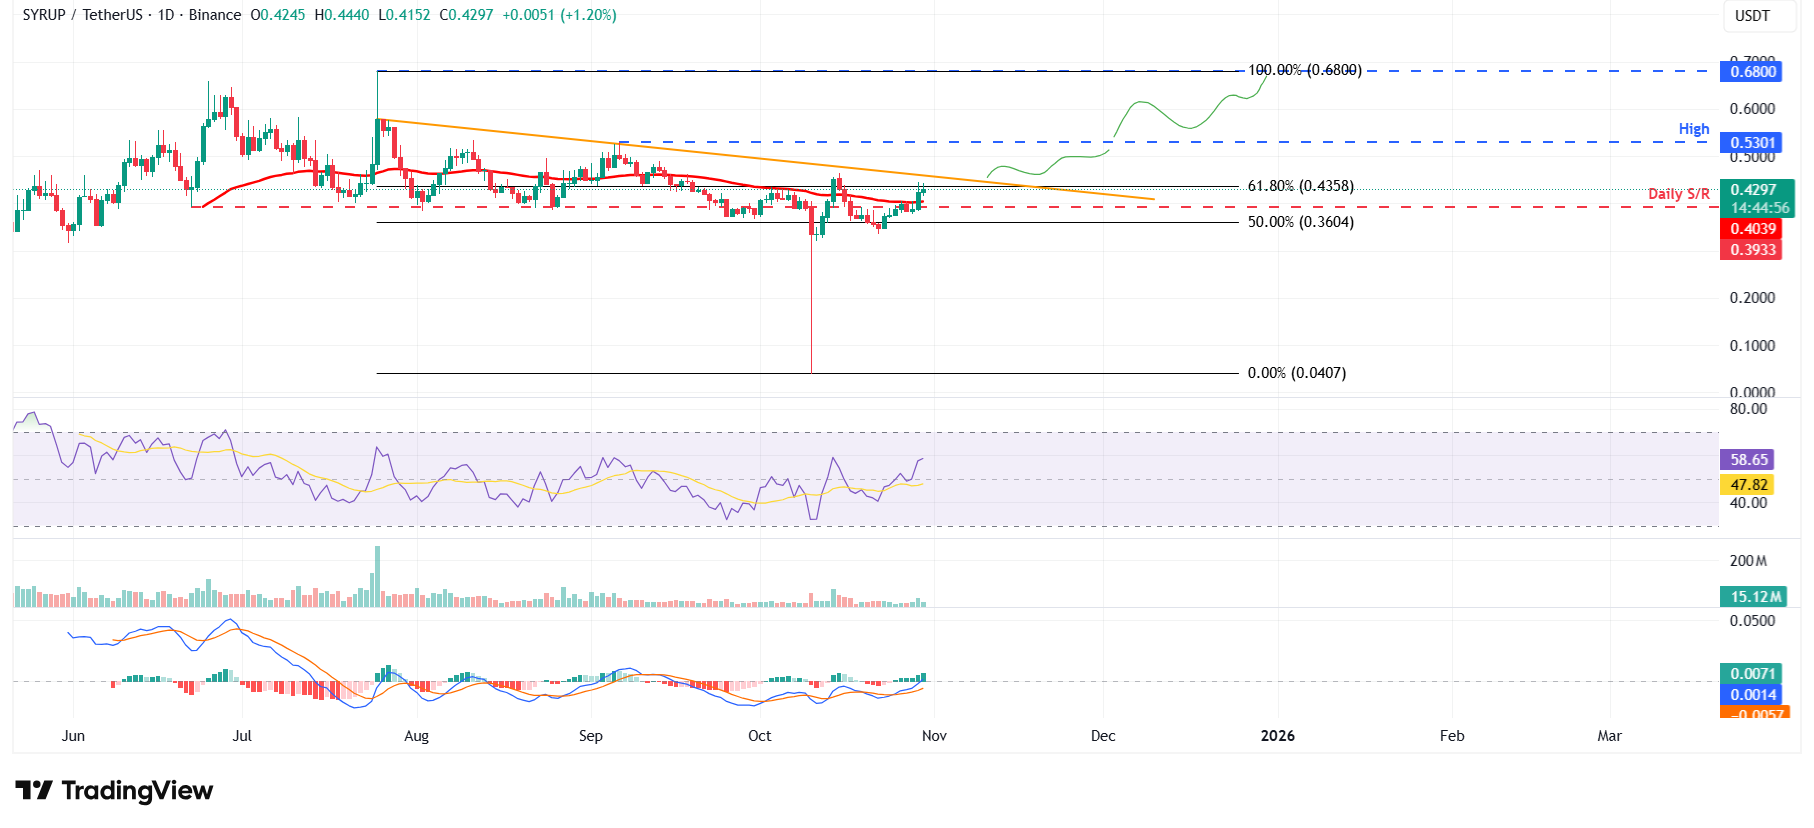
SYRUP/USDT daily chart
On the other hand, if SYRUP faces a correction, it could extend the decline toward the daily support at $0.39.
Recommended Articles


