

Chainlink Bears Show Strength, But $16 Support Could Flip The Downtrend

Source Newsbtc

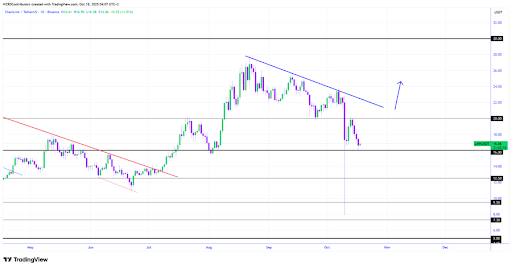
In his latest Chainlink daily technical outlook, CryptoWzrd noted that the token closed bearish, retesting the $16.00 daily support level. He mentioned plans to monitor its intraday chart closely for potential quick scalp opportunities, particularly if LINK holds above $16.80, which he views as a positive zone.

A Possible Shift In Chainlink’s Current Bearish Action

Moving on, CryptoWzrd pointed out that both Chainlink and LINKBTC closed the day with bearish candles, signaling short-term weakness. The downside move came after a period of consolidation, suggesting that traders may be taking profits following recent gains. Despite the pullback, the analyst emphasized that the overall market context still holds potential for recovery.

He further explained that LINKBTC could experience an upward push if Bitcoin dominance shows positive sentiment tomorrow. A recovery in Bitcoin’s strength often translates to renewed confidence in the broader altcoin market, and LINK could benefit from this correlation. 
Chainlink

According to CryptoWzrd, LINK’s retest of the $16 daily support level played out exactly as anticipated. This zone now represents a crucial decision point, holding above it could trigger a rebound toward the next major resistance of $20 and beyond if market conditions remain stable.

However, he cautioned that with the weekend approaching, volatility may rise and market volume could thin out. As a result, CryptoWzrd maintained a balanced stance, noting that it is essential to keep expectations rational and remain alert for any signs of renewed bearish pressure.

Bullish Breakout Could Ignite A Rally Toward $19.30

Concluding his analysis, CryptoWzrd noted that Chainlink’s intraday chart displayed notable volatility throughout the day, with rapid price swings keeping traders on edge. Despite the choppy movements, the price is now teasing the $16.80 intraday resistance, a level that could play a pivotal role in determining the next short-term direction.

He explained that a bullish breakout above $16.80 would likely trigger a wave of renewed buying pressure. Such a move could pave the way for a rally toward the $19.30 target, an area where previous price action has shown a strong reaction and potential for profit-taking. 

On the other hand, CryptoWzrd cautioned that a rejection from $16.80 or prolonged trading below this resistance could lead to more sideways movement over the weekend. With lower trading volumes expected, this range-bound behavior may continue until a clear catalyst emerges to drive momentum in either direction. 

He concluded by emphasizing the importance of patience and clarity in the current setup. The market is at a decision point, and waiting for a stronger trade formation could offer a safer entry opportunity.

Chainlink
Disclaimer: For information purposes only. Past performance is not indicative of future results.
placeholder
The Fed will sit still on October 28 — but 100 of 100 economists now expect a December hikeA Reuters poll run October 16-20 found 94 of 100 economists expecting the Fed to hold at 3.75-4.00% on October 28 — and all 100 expecting a hike in December, against less than half a month earlier. The market is close to the same price, with CME FedWatch at roughly 17% for October and 82.8% for December. With the Fed in blackout since October 17, here are the five dates that decide the rest of the year, what each one is priced for, and the two directions each can take.
Author  Irene Q.
Oct 22, Thu
A Reuters poll run October 16-20 found 94 of 100 economists expecting the Fed to hold at 3.75-4.00% on October 28 — and all 100 expecting a hike in December, against less than half a month earlier. The market is close to the same price, with CME FedWatch at roughly 17% for October and 82.8% for December. With the Fed in blackout since October 17, here are the five dates that decide the rest of the year, what each one is priced for, and the two directions each can take.
placeholder
Gold Price Analysis Today | Forex Gold Analysis | XAU/USD Analysis - October 26, 2026Get the latest gold price analysis, forex gold insights, and XAU/USD analysis for October 26, 2026. Read on for the details.
Author  Mitrade
Yesterday 01: 52
Get the latest gold price analysis, forex gold insights, and XAU/USD analysis for October 26, 2026. Read on for the details.
placeholder
Big Tech's $800 billion AI bill faces its first real test — free cash flow is the judgeAlphabet and Microsoft report after the close on October 28, Amazon on October 29, with hyperscaler AI capex running near $800 billion a year. Meta's negative free cash flow and 9.40% drop on October 22 was the warning; this week's prints decide whether cloud growth and backlog can pay for the buildout. Here are the consensus numbers, the free-cash-flow table and the two-sided test.
Author  Irene Q.
Yesterday 05: 32
Alphabet and Microsoft report after the close on October 28, Amazon on October 29, with hyperscaler AI capex running near $800 billion a year. Meta's negative free cash flow and 9.40% drop on October 22 was the warning; this week's prints decide whether cloud growth and backlog can pay for the buildout. Here are the consensus numbers, the free-cash-flow table and the two-sided test.
placeholder
Gold breaks $4,000 as oil becomes the inflation problem — $3,943 is the line that mattersSpot gold closed at $3,995.6 on October 23, down about 4.1% for the week and at its lowest since mid-July, and traded near $3,988 on October 26 even as Brent crude settled at $116.72 and Middle East supply risk stayed elevated. The war premium stopped working because oil is now the inflation trade: December Fed hike odds are 68.9% and the 10-year yield is 4.988%. Here are the three numbers, the transmission chain, and the July low at $3,943 that decides whether this is a bottom or a bigger correction.
Author  Irene Q.
Yesterday 06: 41
Spot gold closed at $3,995.6 on October 23, down about 4.1% for the week and at its lowest since mid-July, and traded near $3,988 on October 26 even as Brent crude settled at $116.72 and Middle East supply risk stayed elevated. The war premium stopped working because oil is now the inflation trade: December Fed hike odds are 68.9% and the 10-year yield is 4.988%. Here are the three numbers, the transmission chain, and the July low at $3,943 that decides whether this is a bottom or a bigger correction.
placeholder
Bitcoin Price Forecast: Drops Below $80,000 in Fifth Straight Loss, May Test $75,000 as FOMC Meeting Approaches Bitcoin falls below the $80,000 mark as the October FOMC decision approaches, threatening a further dip toward $75,000.On October 26, Bitcoin (BTC) again lost the key psychological mark o
Author  TradingKey
Yesterday 10: 10
Bitcoin falls below the $80,000 mark as the October FOMC decision approaches, threatening a further dip toward $75,000.On October 26, Bitcoin (BTC) again lost the key psychological mark o
goTop
quote