
Cardano Price Forecast: ADA eyes further gains as selling pressure wanes
- Cardano approaches the apex of a symmetrical triangle pattern formed on the daily chart.
- On-chain data suggests that selling pressure is decreasing as profit-taking declines, and the percentage of supply in profit increases.
- Derivatives data indicate an increase in retail interest as Open Interest rises.
Cardano (ADA) remains on the edge, pulling back 1% at press time on Tuesday after gaining over 4% the previous day. The rising retail demand and declining selling pressure signals from the on-chain data align with the broader market optimism around the “Uptober” narrative.
Technically, Cardano approaches the apex of a symmetrical triangle pattern on the daily chart, keeping the situation on a knife-edge.
Retail demand for Cardano increases as selling pressure wanes
The investors' profit-booking spree has been cooling down over the last few weeks, alleviating the selling pressure. Santiment data shows the Network Realized Profit/Loss (NRPL) indicator has made lower peaks following the profit-taking of 51.57 million ADA on September 24. A decline in profit-taking spree indicates that investors are tilting towards holding or potentially acquiring more ADA, which signals increased confidence in the token.
Corroborating the decline in selling pressure, the percentage of ADA supply in profit has reached 78.62%, up from 69.21% on September 24, indicating increased demand, with room for further growth before reaching the overheated levels above 90%.
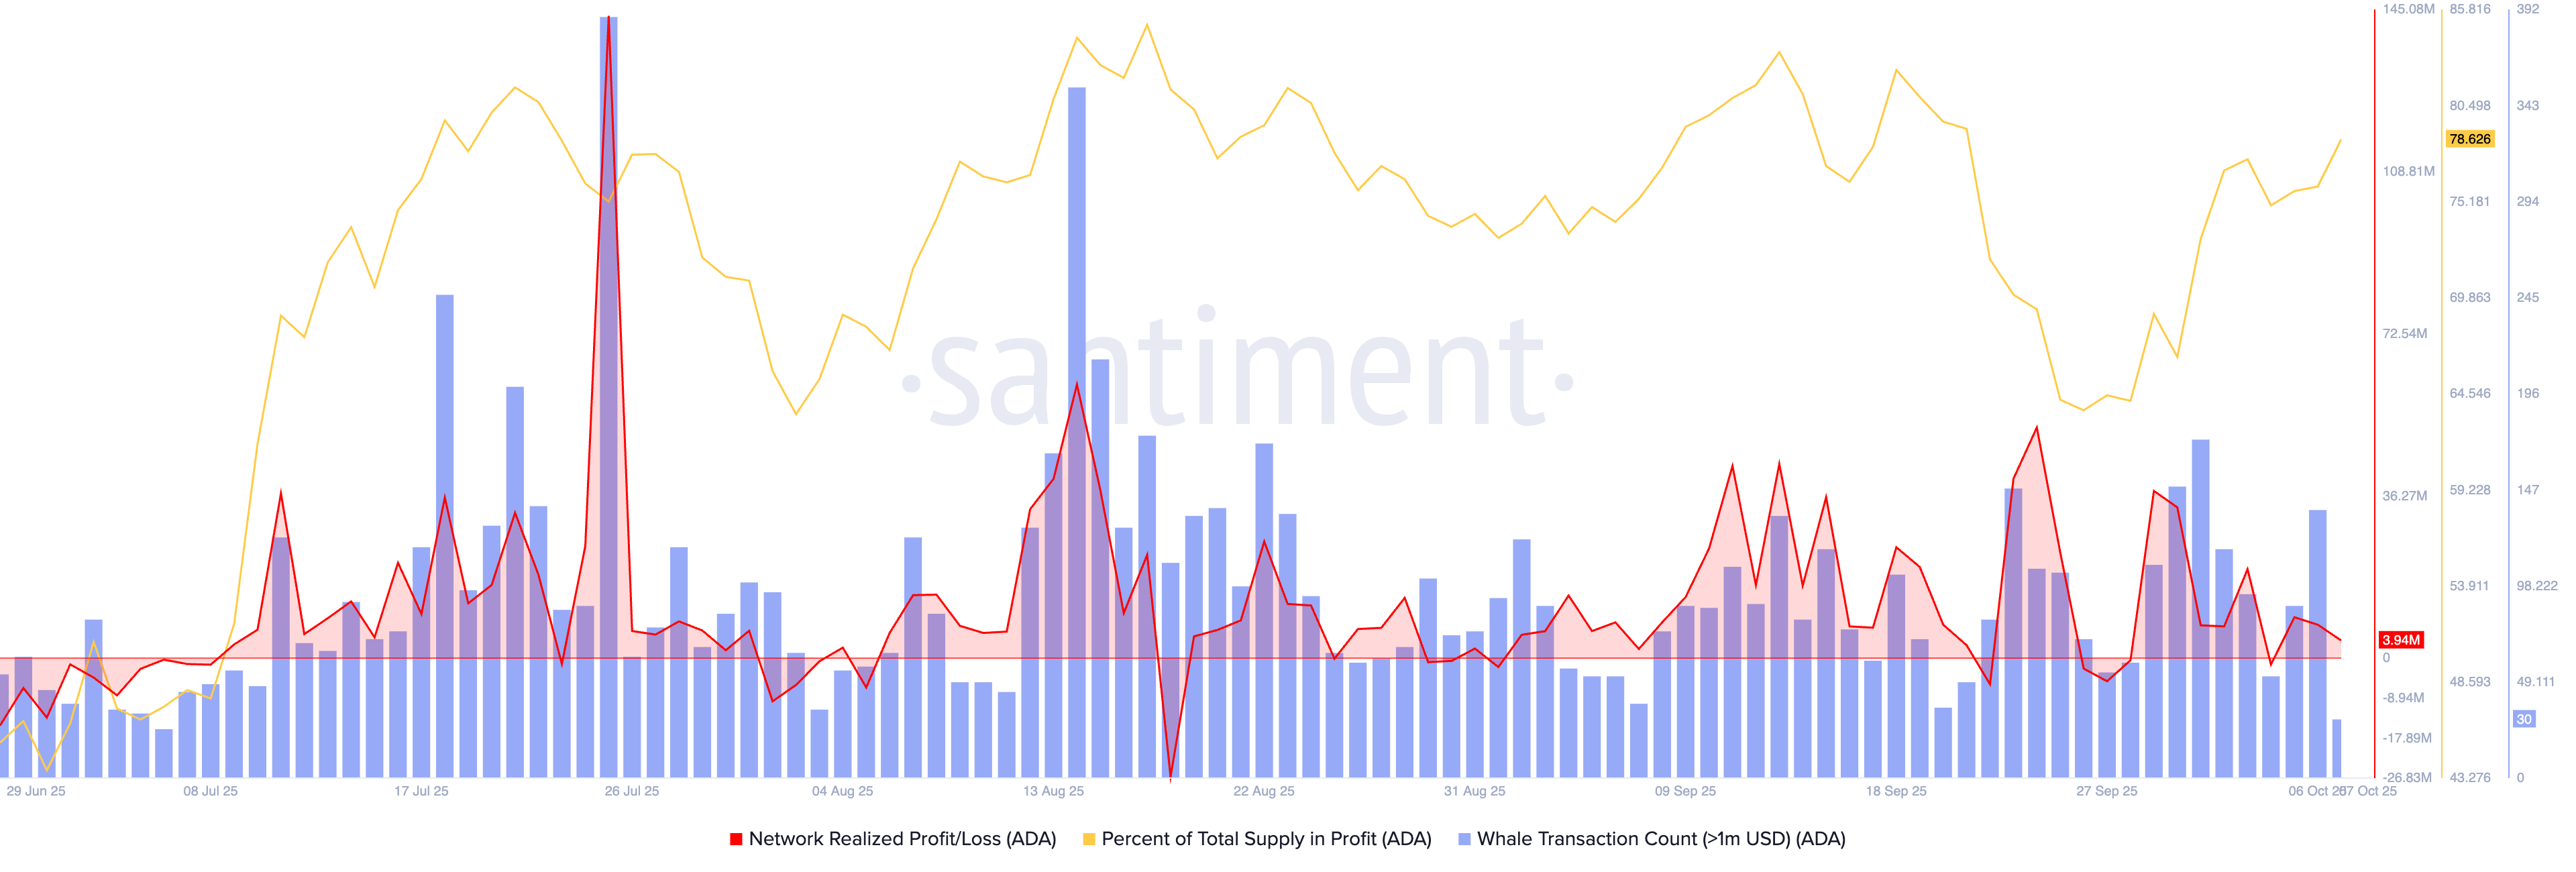
Cardano's NRPL and percentage of supply in profit. Source: Santiment
In the meantime, retail demand is also growing in ADA derivatives, as CoinGlass data reveals that the Cardano Futures Open Interest (OI) has increased by over 5% in the last 24 hours, reaching 1.72 billion. A sudden recovery in OI implies a rise in long positions that have been built up as traders anticipate further gains.
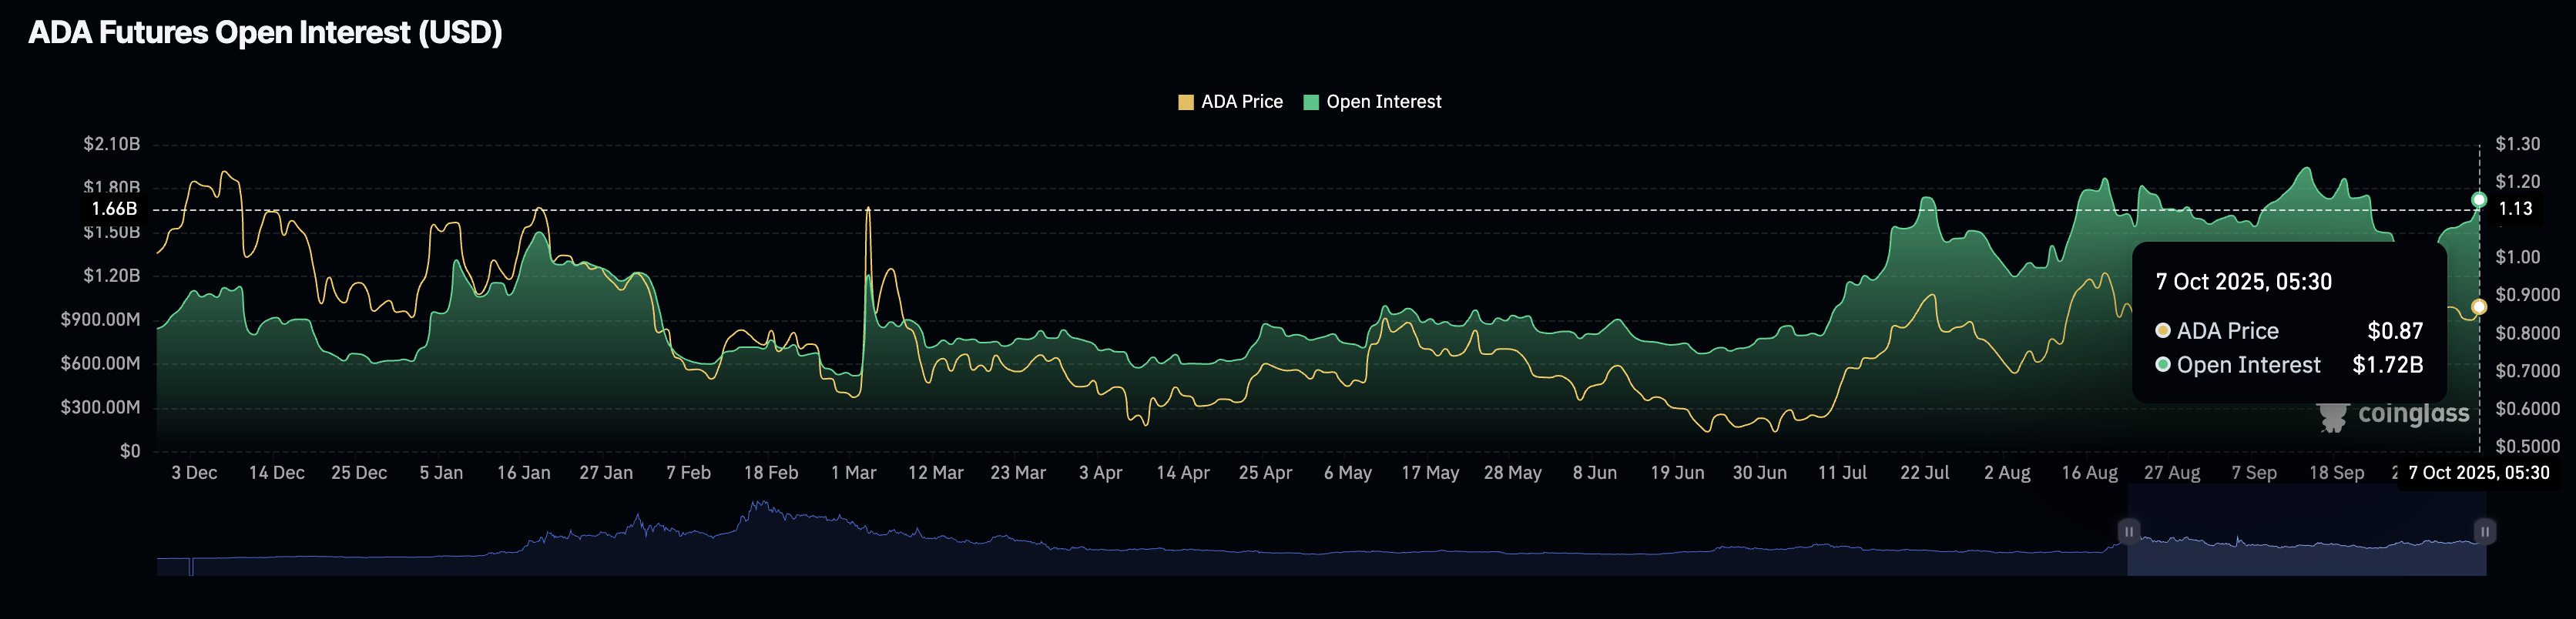
ADA Futures Open Interest. Source: CoinGlass
Cardano remains trapped in a symmetrical triangle pattern
Cardano trades above $0.8500 at press time on Tuesday, extending the sideways movement within a symmetrical triangle pattern formed on the daily chart. ADA consolidates between the two converging trendlines, as the frequency of to and fro within the triangle could increase near the apex.
Still, a decisive close above the trendline or the 50% Fibonacci retracement level at $0.9182, drawn from the December 3 high of $1.3264 to the June 22 low of $0.5100, could reinforce the next uptrend. The potential Cardano rally could find resistance at the 61.8% and 78.6% Fibonacci retracement levels at $1.0145 and $1.1517, respectively.
The indicators on the daily chart suggest a bullish trend in motion, gradually gaining strength as the Moving Average Convergence Divergence (MACD) extends an uptrend after crossing above its signal line on Thursday.
Additionally, the Relative Strength Index (RSI) reads 53 on the same chart, rising above the halfway line but struggling to surpass a descending trendline. If the RSI extends a steady upward rise above the halfway line, it would unleash fresh bullish momentum.
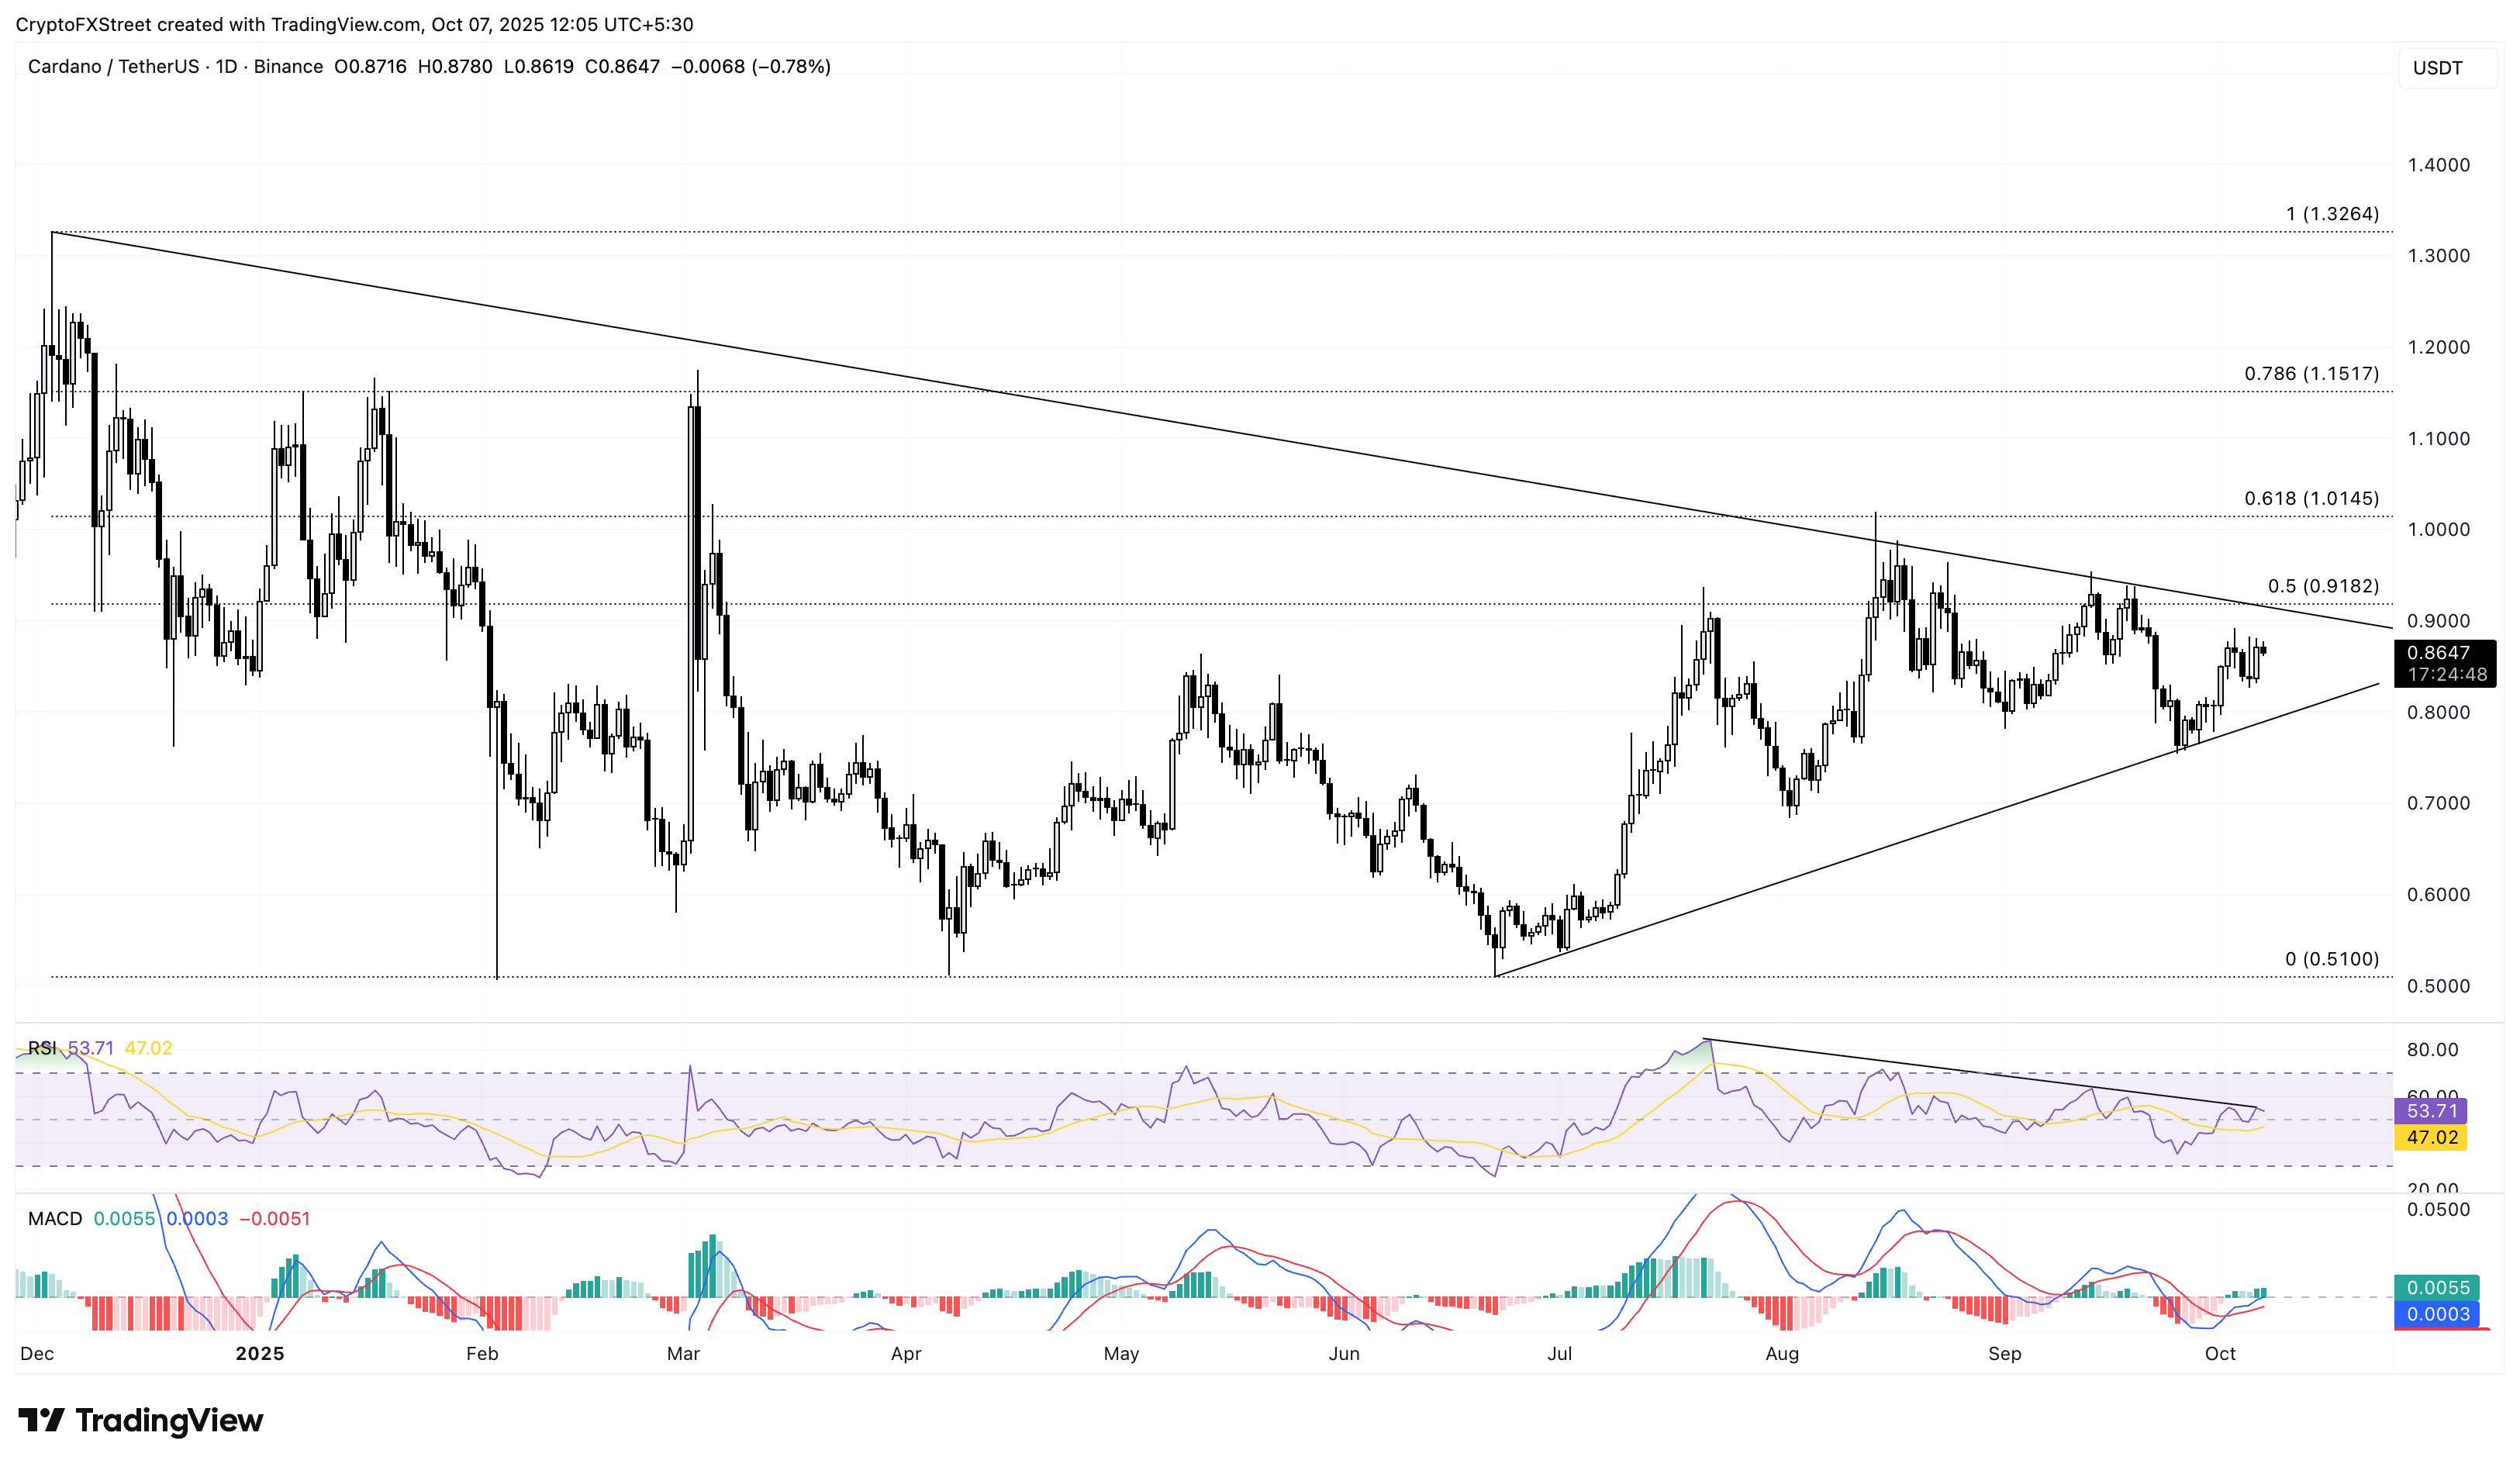
ADA/USDT daily price chart.
Looking down, if ADA slips below $0.8000, it would confirm the triangle’s downside breakout. In such a case, the key support areas are the round figures of $0.7000 and $0.6000.
Recommended Articles


