

The Dollar Is Back — And Bitcoin May Be in Trouble

- Gold Price Forecast: Oil Price Breaking $100 Fuels Inflation Concerns, Will Gold Prices Fall Further?
- Gold Price Trend Forecast: Expectations of Easing US-Iran Tensions Boost Gold Prices, $4,070 Becomes Key Level for Bulls and Bears
- Gold rallies to over two-week high, eyes $4,150 as traders track US-Iran diplomacy efforts
- Euro declines to near 1.1400 as US launches fresh strikes on Iran
- Tesla Q2 Earnings Preview: Record Deliveries Fail to Hide Profit Pressure, Can Musk Rely on AI and Autonomous Driving to Unlock New Growth Space?
- WTI climbs above $87.00 as Middle East conflict threatens key choke points
After nearly three months of range-bound trading, the US Dollar Index (DXY) has broken above the 100 mark, its highest level since August, reigniting concerns across risk asset markets.
The strengthening greenback is prompting investors to ask: Is this merely a short-term technical rebound, or the beginning of a new liquidity-tightening cycle that could pressure Bitcoin and the broader crypto market?
The US Dollar Enters a Phase of Strength Consolidation
According to TradingView, the US Dollar Index (DXY) has surged past the 100 threshold, signaling a strong return for the dollar after months of weakness since the third quarter. The DXY spiked to 99.98, marking a two-month high after the Fed left interest rates unchanged in its last meeting.
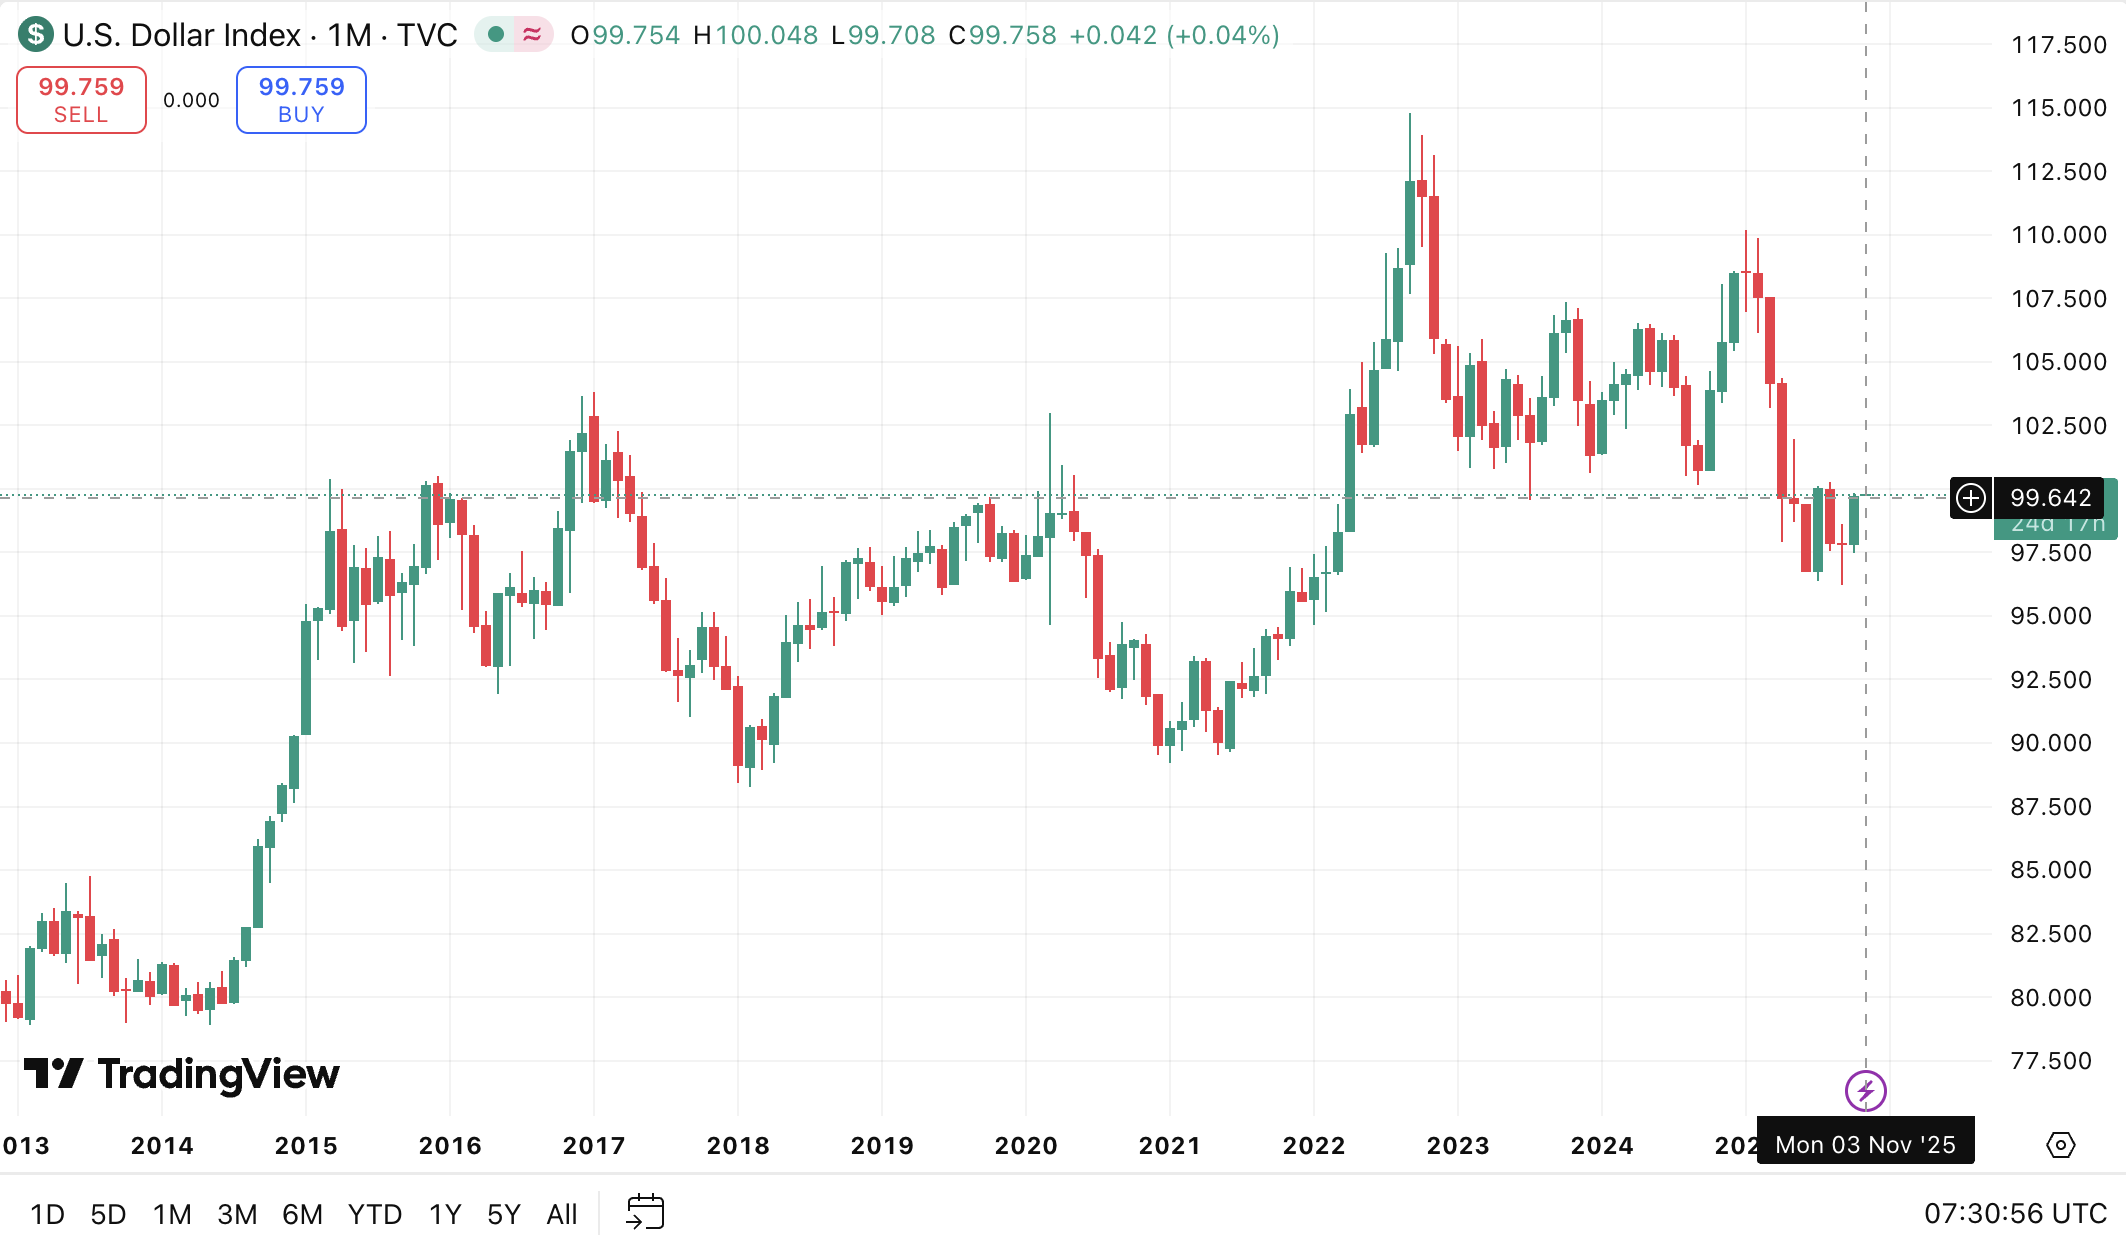
Analyst Ted notes that DXY is forming a golden cross on the daily chart, a technical pattern often associated with a sustained bullish trend.
“The dollar keeps on getting stronger, and this isn’t a good sign for the crypto market,” he commented.
Meanwhile, an expert on X warns that this could be a “big test” for the ongoing rally as DXY approaches a key horizontal resistance and the 200-day moving average. This decisive zone could determine the next trend.
Some analysts believe this move could be a technical back-test before a potential reversal. According to another X user, DXY’s monthly structure suggests a bearish retest, implying a possible short-term pullback before resuming a medium-term uptrend.
Regardless of the short-term direction, the dollar’s resurgence again exerts psychological pressure on risk assets, from equities to crypto.
Bitcoin Faces the Headwind: Understanding the BTC DXY Correlation
Historically, Bitcoin (BTC) has negatively correlated with the DXY. When the dollar strengthens, risk appetite tends to fade, often leading to price corrections in BTC. According to a chart shared on X, Bitcoin has closely “followed” DXY’s movements throughout the past quarter, highlighting the inverse BTC DXY correlation that continues to define macro sentiment.
According to data from Ted Pillows, DXY rose from 98 to nearly 99.7 from September onward, while Bitcoin dropped over 12% and gold fell by around 6%.
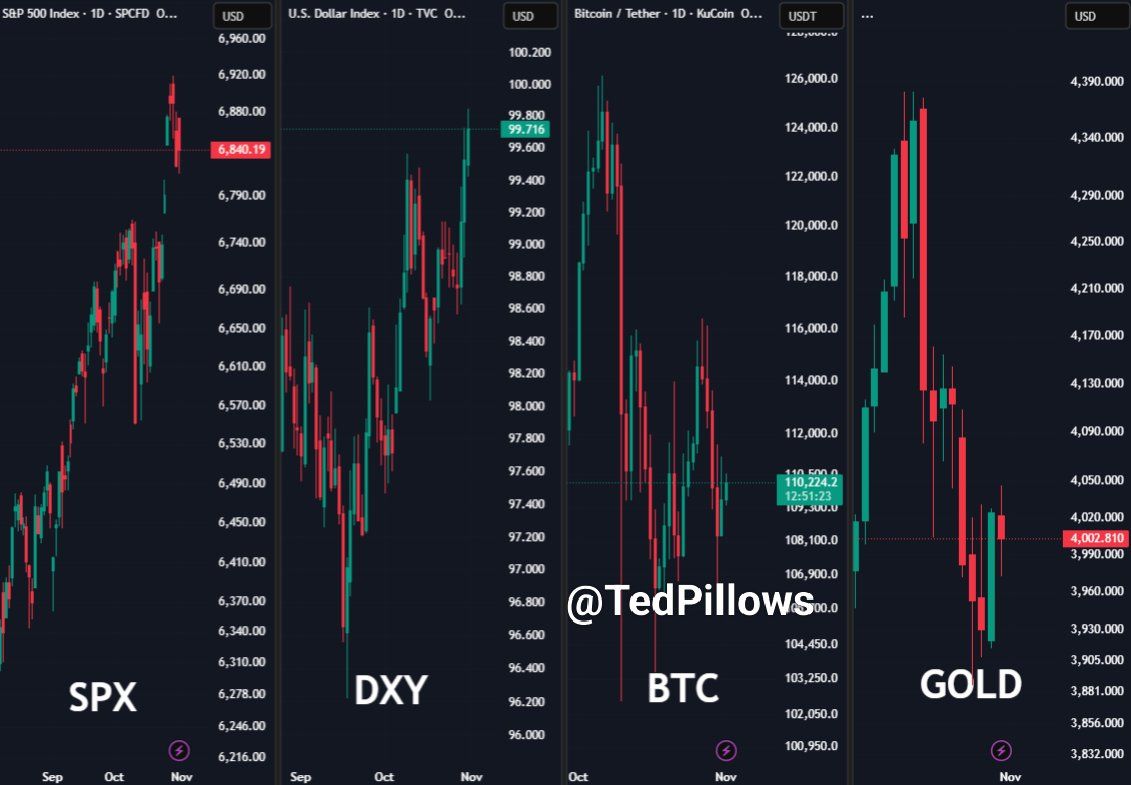
BTC–DXY correlation chart. Source: Ted
Brett’s analysis shows that the 100 level remains critical support on the weekly DXY chart. The last time DXY rebounded from this level, in May 2025, Bitcoin broke to new all-time highs, fueled by a temporary USD pullback. While history could repeat itself, the risk of an inverse outcome looms large if the dollar’s current recovery proves more durable.
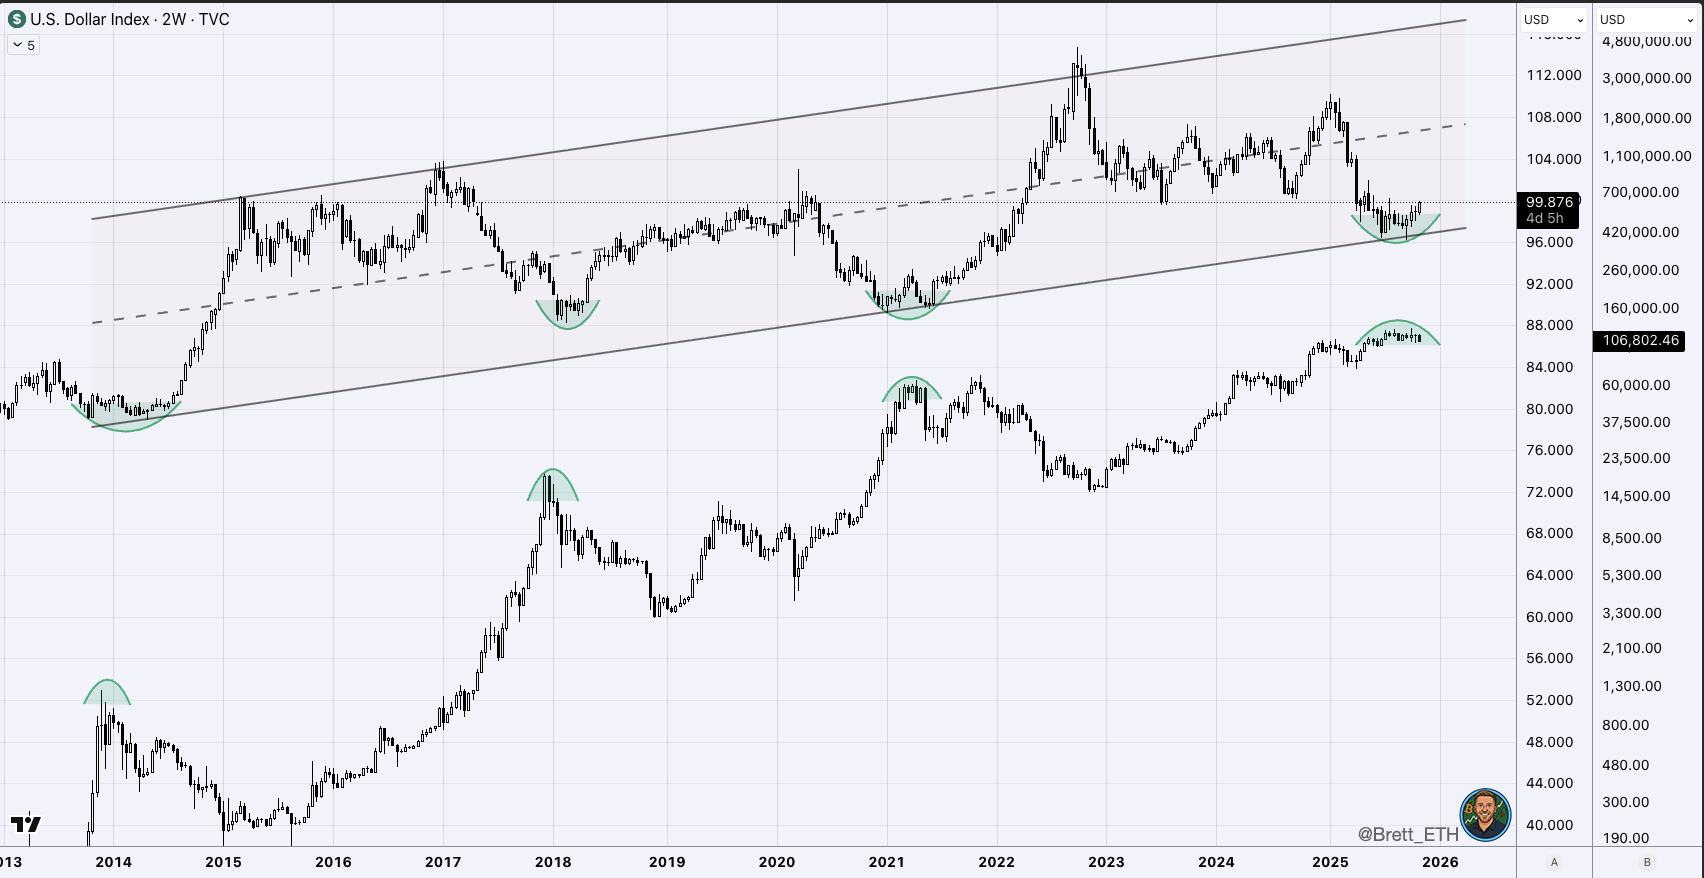
Another trader emphasizes that Bitcoin’s next major move will likely hinge on DXY’s trajectory: if the dollar breaks above 101, a bearish continuation scenario for BTC could unfold; conversely, if DXY fails to hold the 100 zone, it might signal a short-term relief rally for crypto markets.
The BTC DXY correlation remains one of traders and investors’ most crucial macro indicators. As the dollar strengthens, Bitcoin’s short-term upside may face resistance. Yet, if DXY’s momentum fades, crypto could regain its footing heading into the year’s end, once again proving that macro tides, not just on-chain dynamics, dictate the rhythm of digital assets.
Read more
* The content presented above, whether from a third party or not, is considered as general advice only. This article should not be construed as containing investment advice, investment recommendations, an offer of or solicitation for any transactions in financial instruments.


