
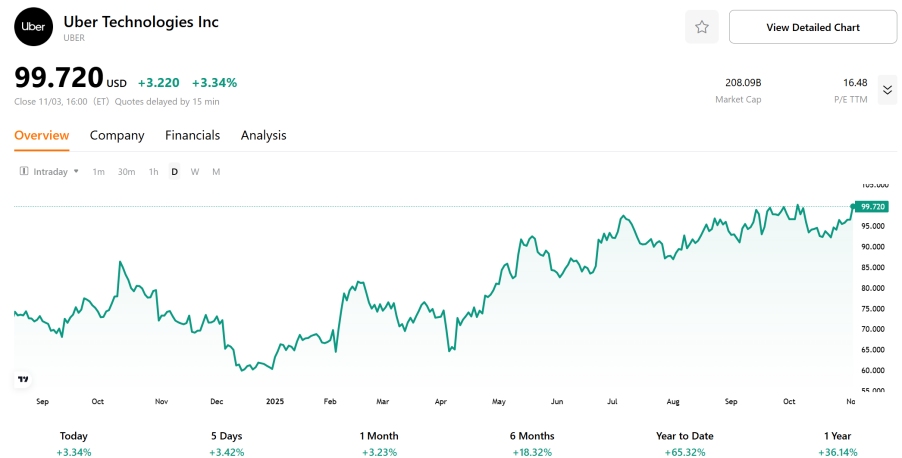
Uber Q3 Earnings Deep Dive: Delivery Surging Ahead, AV Strategic Layout, Valuation Yet to Reflect Long-Term Value
TradingKey - Uber, a paragon of the sharing economy founded in 2009, has become the leader in the ride-hailing industry, operating mobility, delivery, and freight services across 70+ countries and 15,000+ cities. This model has profoundly disrupted the traditional taxi market, propelling Uber's transformation into a highly sticky super app. The Uber One membership service acts as a key catalyst, driving user stickiness and cross-business synergy. The era of reckless cash burning is history; thanks to its dominant market position, solid user base, and driver network, Uber has evolved into a free cash flow machine with thoroughly improved financial health, capable of steadily generating substantial free cash flow. But why did the stock drop more than 5% at one point after the earnings release?
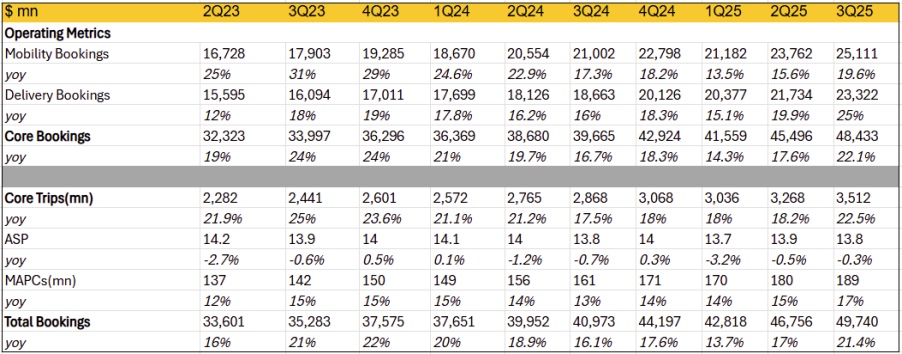
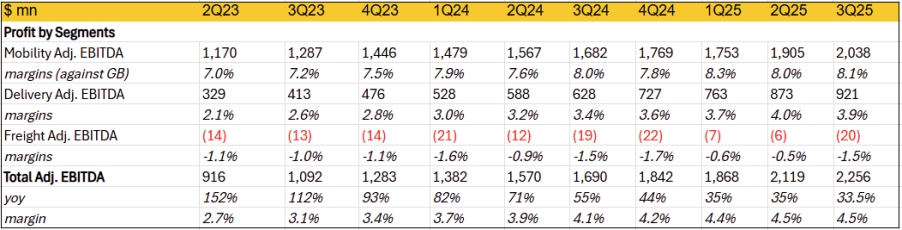
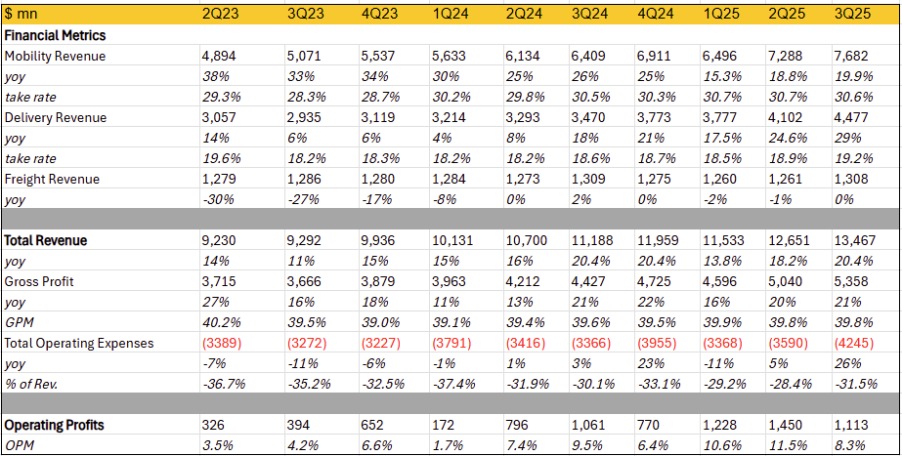
In Q3 2025, Uber delivered a report card that comprehensively exceeded expectations: revenue reached $13.5 billion, up 20% year-over-year; gross bookings hit $49.74 billion, up 21% year-over-year; adjusted EBITDA reached $2.3 billion, up 33.5% year-over-year, with margins expanding to 4.5%. Core profitability was impressive, with net income at $6.6 billion, up 154% year-over-year, and GAAP EPS at $3.11, up 159% year-over-year—primarily driven by one-time items including a $4.9 billion tax valuation allowance release and $1.5 billion in equity investment revaluations. Adjusted EPS was $1.20, up 74% year-over-year. Over the past 12 months, Uber generated a cumulative $8.7 billion in free cash flow, fully realizing its hallmark free cash flow machine attributes. The only blemish was operating profit dragged by $479 million in one-time legal and regulatory expenses; excluding this, operational efficiency still improved significantly.
Business Segment Performance: Delivery Soaring, Ride-Hailing Under Pressure, Freight Dragging
· Mobility: Gross bookings grew 20% YoY, with nominal QoQ acceleration of 4%, but only 1% after excluding FX, far less impressive than it appears. The slowdown recovery was mainly due to a low base from last quarter's insurance drag, with impact easing this quarter. Revenue growth was similarly weak, accelerating only 1% QoQ, lagging bookings, due to take rate increasing just 8 bps YoY and slightly declining QoQ. Insurance costs have been passed to consumers, compounded by competition, leading to revenue growth falling short of expectations. Adjusted EBITDA margin was 8.1%, up only 0.1% YoY, reflecting monetization stagnation and rising costs, slightly below market expectations.
· Delivery: Delivery surged with gross bookings up ~25% YoY, still accelerating 4% QoQ ex-FX, marking three consecutive quarters of gains. Grocery and daily essentials annualized bookings reached $12 billion (vs. $10 billion last quarter), accounting for 17% of total bookings and driving recent acceleration. This boosted MAUs up 17% and trip frequency up 4%, pushing trip volume growth to 22.5% with significant QoQ acceleration. Average Spend per MAPC fell 0.3% YoY, but take rate rose ~60 bps on a high base, mainly from ads surging nearly 80%, ultimately driving revenue growth to accelerate 4% QoQ to 29%, far outpacing bookings and becoming the quarter's core highlight. Despite margin declining 0.1% QoQ with YoY improvement narrowing, profits beat expectations due to revenue outperformance.
· Freight: Freight revenue was ~$1.31 billion, flat YoY, but losses widened to $20 million, more than doubling from the prior two quarters, becoming a profitability drag.
Profits and Expenses: Gross Profit Stagnant, Expenses Surging, Profits Underperforming
Uber's growth momentum was strong this quarter, but profits lacked upside surprises. Gross profit grew 21% YoY, with gross margin at 39.8%, up only 0.2% YoY and flat QoQ—unexpected amid FX tailwinds, strengthening scale effects, and ad monetization gains. The core drag was high insurance cost growth passed to slightly lower basket sizes.
Meanwhile, expenses accelerated markedly, up 26% YoY, primarily driven by $479 million in one-time legal/regulatory costs; even excluding these, growth was 12%, a clear expansion from the <10% or even negative trend since 2023, mainly due to ramped AV investments. With gross margin gains stalled and expense growth rising, adjusted EBITDA was ~$2.26 billion, up 33.5% YoY but slightly missing expectations; margin at 4.54%, up only 41 bps YoY—the lowest expansion since 2022.
Overall, Uber's Q3 performance was solid, driven by the dual engines of 17% year-over-year growth in monthly active platform consumers (MAPC) to 189 million and a 4% increase in order frequency (monthly Trips per MAPC). This was primarily fueled by penetration in grocery and essentials delivery, with annualized bookings reaching $12 billion (up from $10 billion last quarter), accounting for 17% of total delivery bookings. This expansion drove both new user acquisition and enhanced stickiness among existing users, pushing total trips to 3.5 billion (+22% YoY). Despite a 0.3% year-over-year decline in average order value, which constrained revenue and gross margin growth, the 33% adjusted EBITDA growth remains impressive. The business highlight lies in delivery's natural extension into groceries and essentials, which not only added incremental order volume but also significantly expanded advertising monetization opportunities.
Looking to Q4, management guides gross bookings of $52.25–53.75 billion (17%–21% YoY) and adjusted EBITDA of $2.41–2.51 billion (31%–36% YoY). Though below analyst expectations and triggering a share pullback, I believe the market may overlook Uber's two key future growth drivers—autonomous vehicles (AV) and advertising—which will contribute long-term moats and short-term high-margin cash flows, respectively.
Autonomous Vehicles (AV): Light-Asset for Long-Term Moat
Uber's AV business is accelerating as a diversification core. Still in loss-making investment phase, management views it as high-potential, using a "platform + partners" model to avoid self-R&D risks, leveraging massive data and ops experience to build a robotaxi network. CEO emphasizes loss-first-then-profit, funded by premium businesses for expansion, forming a human + AV hybrid model, with scaled profitability expected in a few years.
Key Strategic Partnerships: Uber has 14 AV partners cumulatively, with Q3 focus on NVIDIA (Oct: co-building Hyperion L4 architecture, training Cosmos AI with Uber data; initial 5,000 Stellantis vehicles, targeting 100,000 by 2027), Lucid+Nuro (Jul: $300M investment in premium robotaxi, deploying 20,000 Lucid Gravity SUVs over six years), WeRide (Saudi launch, five-year entry into 15 European cities), May Mobility (May: Arlington deployment of thousands), Waymo (Phoenix hundreds in operation, expanding to Atlanta/Austin).
Geographic Coverage and Expansion: Dual focus on U.S. and international. U.S. includes San Francisco (2026 Lucid/Nuro premium testing), Dallas (Avride/Hyundai), Arlington (May Mobility), with plans for Miami/Washington D.C.; internationally, starting with WeRide in Middle East/Europe, NVIDIA supporting global network, leveraging Uber's 70-country, 15,000-city experience for cross-border scaling.
Scale Targets and Ops Model: Short-term maintain hundreds of test vehicles; mid-term (2026–2027) deploy tens of thousands; long-term 100,000+ (passengers + delivery). Via data sharing, AI training, and infrastructure (charging/maintenance), reduce reliance on 9M human drivers, improving safety and cost efficiency.
Advertising: Short-Term Cash Cow
Uber's ad business is underappreciated yet hugely potential, significantly accelerating future profitability. In Q3 2025, Uber hit all-time highs in user volume and frequency: MAUs up 17% to 189 million, total trips up 22% to 3.5 billion, with ~30 billion app visits by consumers in the past 12 months. This vast attention span offers immense ad monetization potential. Uber has made strides with sponsored ads on Uber Eats and Journey Ads in mobility. Q3 ad annualized run rate ~$1.5 billion, up >60% YoY; though only ~3% of total revenue, it's ramping fast as an emerging business.
Management stresses ads as a merchant growth engine, helping >1.2M merchants drive incremental sales via precise targeting. Unlike core ops, ads require minimal capex to boost margins and synergize with Uber One (36M members, up 60% YoY; cross-platform spend 3x single-platform). Uber's unique real-time data—like user locations and instant purchase decisions—offers unmatched precision, attracting large advertisers. Future plans: ramp investment in ad formats, programmatic buying, new market penetration, and AI-optimized metrics. Expected to contribute >12% to overall revenue growth, becoming a core diversification driver.
Summary
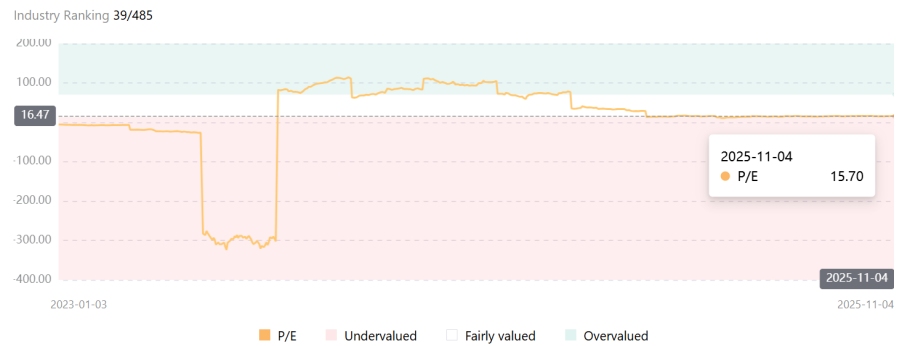
Uber's current 15.7x PE may undervalue the synergy potential of ads and AV. Ads already contribute $1.5B run-rate high-margin cash flow, fully offsetting AV spend; post-2027 100K robotaxi deployment, unit cost declines could drive EBITDA margin to 15%+, supporting long-term valuation uplift. Short-term expense pressure is strategic investment; current pricing fully prices it.
Recommended Articles


