

Avalanche eyes breakout rally as partnership with WeBlock in Korea supports gains
- Avalanche inches closer to a crucial supply zone breakout, targeting the $30 mark.
- AVAX Open Interest crosses $1 billion, hitting a record high.
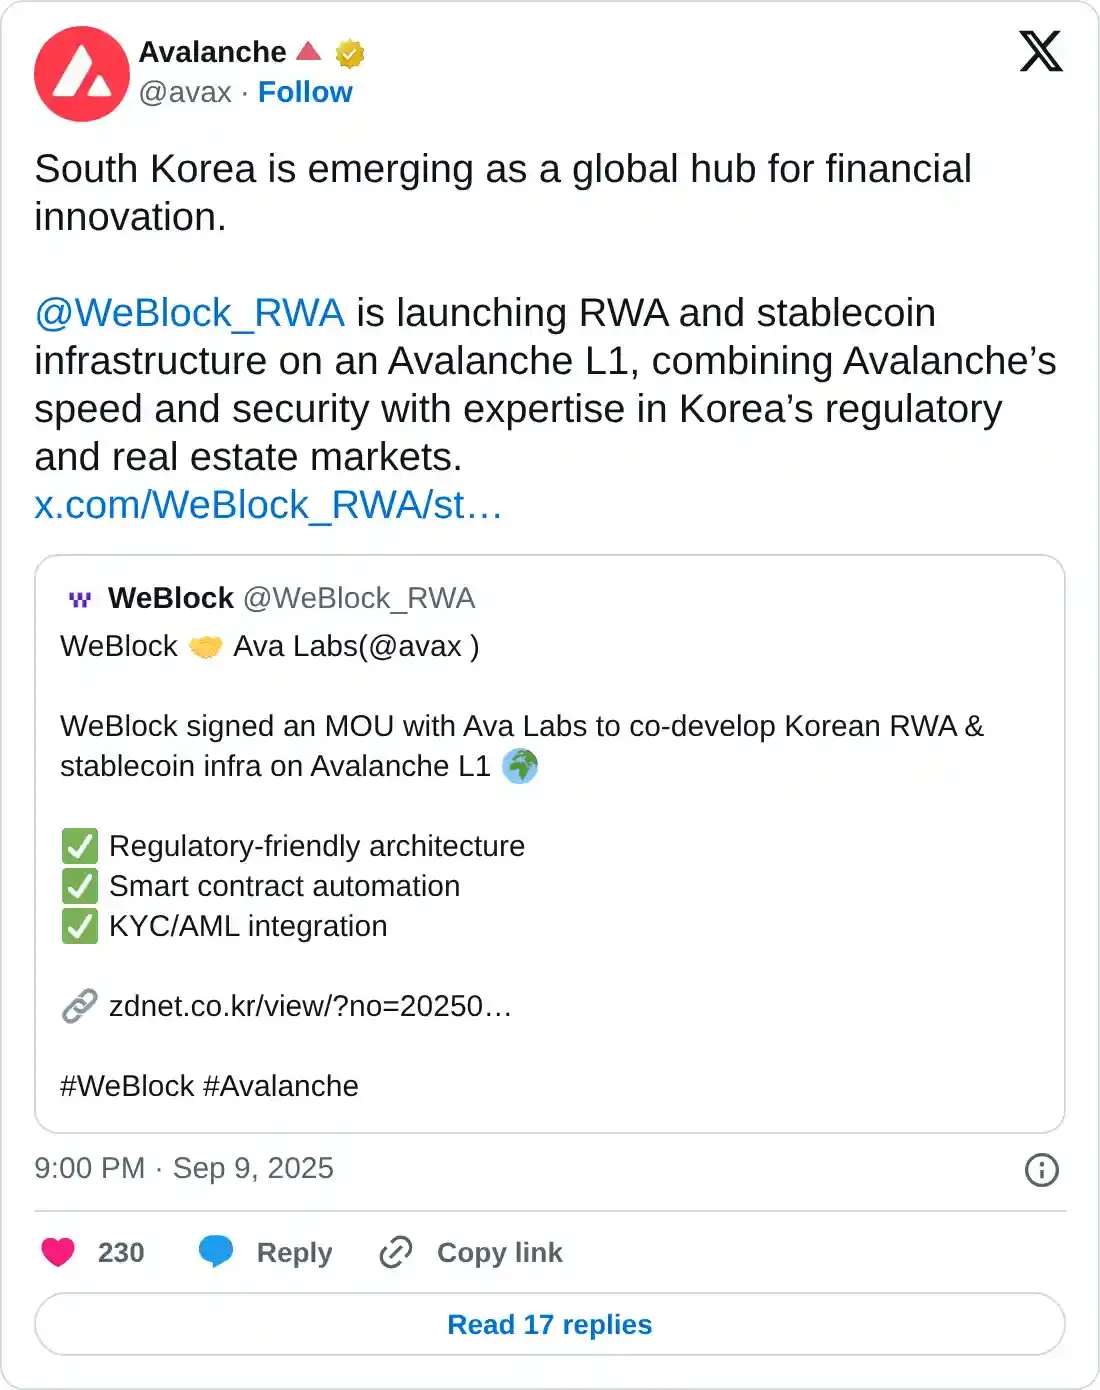
- Ava Labs partners with WeBlock to design Korean RWA and stablecoin infrastructure.
Avalanche (AVAX) price extends the recovery rally to a fourth consecutive day towards a crucial resistance zone, eyeing a potential breakout run to $30 alongside other layer-1 tokens such as Solana (SOL) and Tron (TRX). Interest remains steady for Avalanche as open interest crosses $1 billion after the announcement that Ava Labs has signed a Memorandum of Understanding (MoU) with WeBlock to expand Real-World Assets (RWAs) and the stablecoins market in South Korea.
Ava Labs partners with WeBlock to push tokenization in South Korea
Ava Labs, the team behind Avalanche, signed an MoU agreement with WeBlock to push RWA tokenization and stablecoins in South Korea. The Korean regulation-compliant RWA products will be built on Avalanche’s layer-1 blockchain and integrate Know Your Customer (KYC) and Anti-Money Laundering (AML) features.
The stabelcoin pilot will be released later this year, while the RWA products are scheduled for H1 2026, the company said.
RWA.xyz, a RWA data analytics platform, ranks Avalanche as the eighth-largest project based on the value of tokenized products, including stablecoins. Avalanche holds $3.01 billion worth of tokenized assets, out of which stablecoins account for $2.6 billion, followed by institutional alternative funds with $243.5 million and US Treasury debt ($149.6 million).
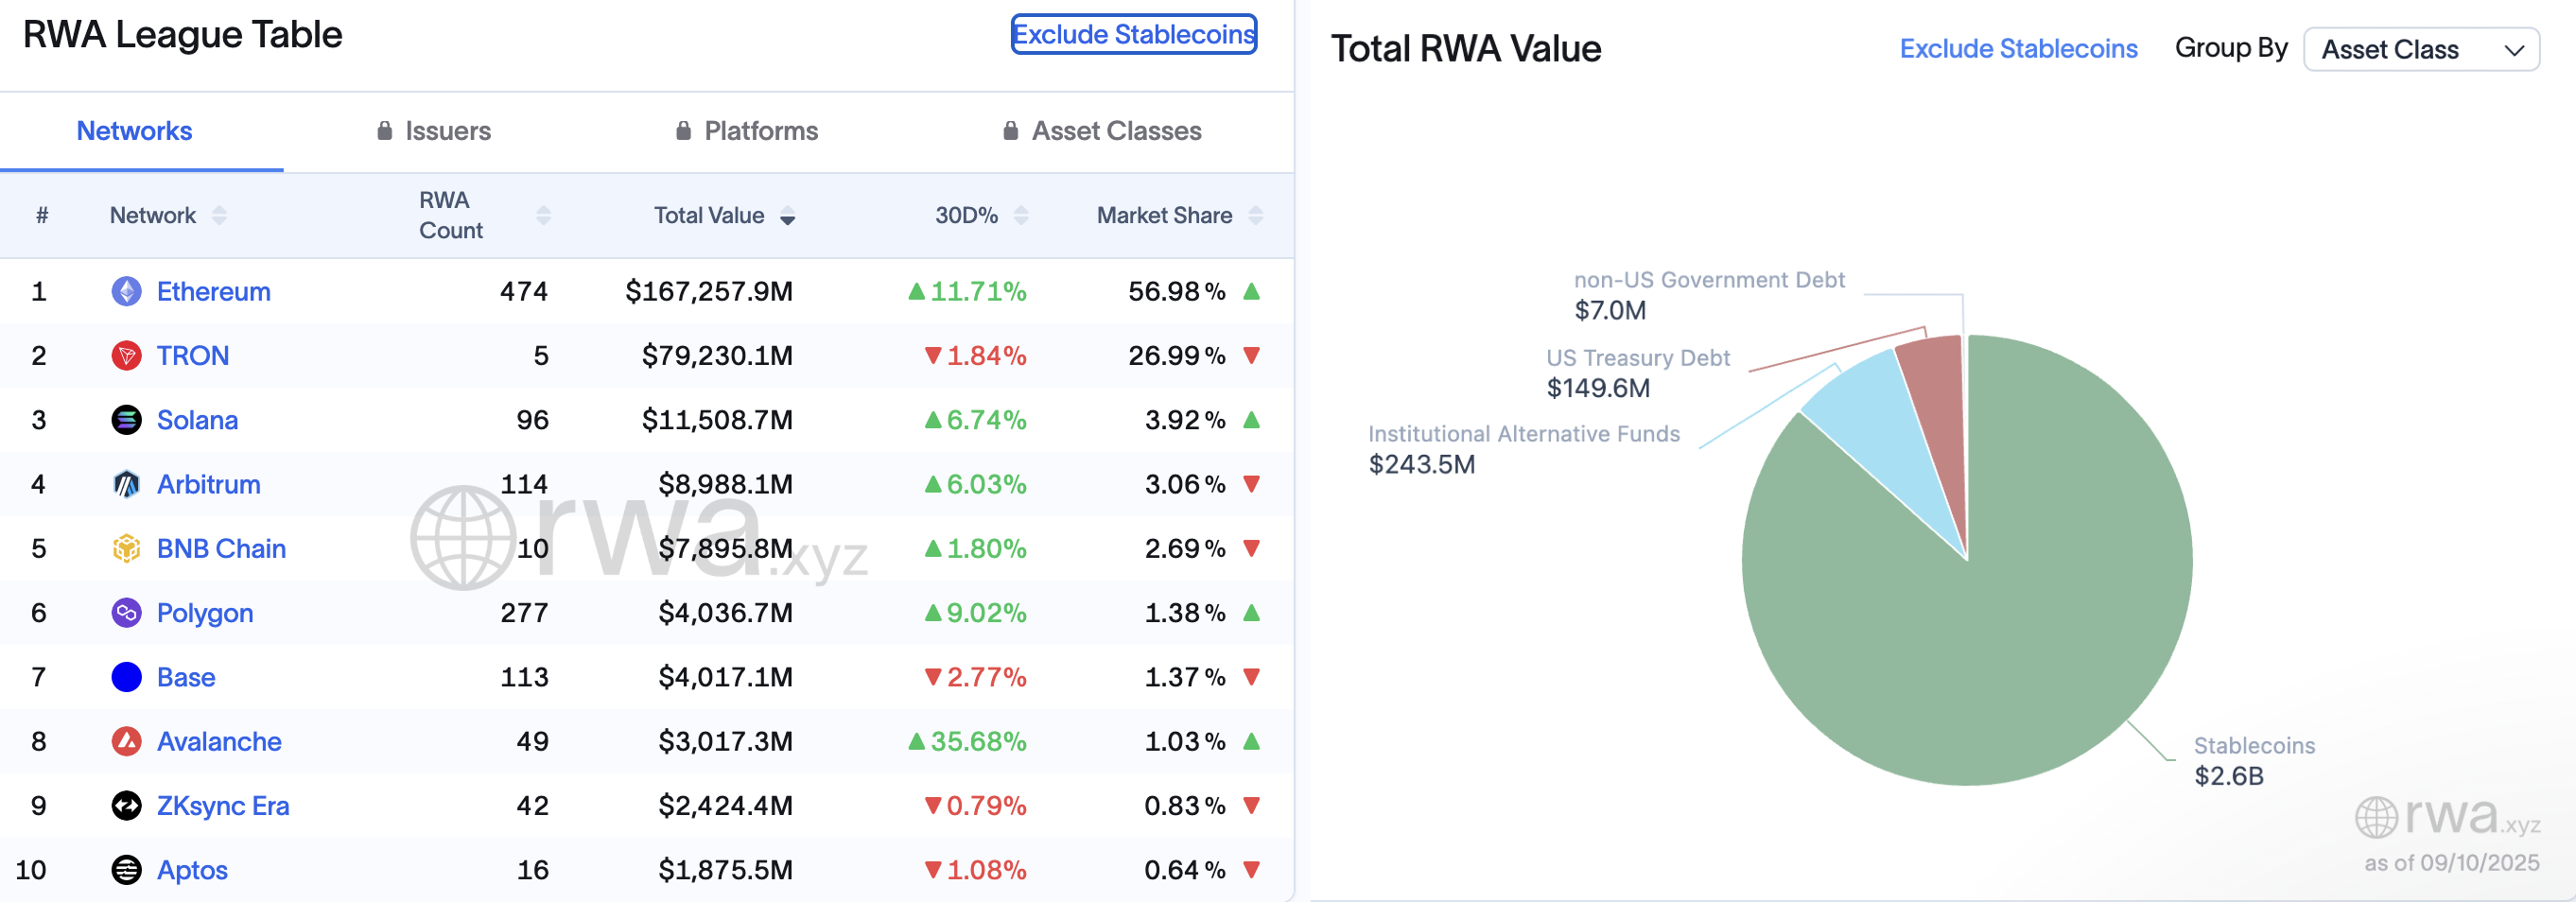
Avalanche RWA metrics. Source: RWA.xyz
Optimism sparks in AVAX Derivatives with record high Open Interest
CoinGlass data shows the AVAX Open Interest (OI) has reached a record high of $1.07 billion, up from $974.94 million on Tuesday. This indicates a significant capital inflow over the last 24 hours, suggesting that the risk-on sentiment has improved among traders as they anticipate a further recovery in Avalanche.
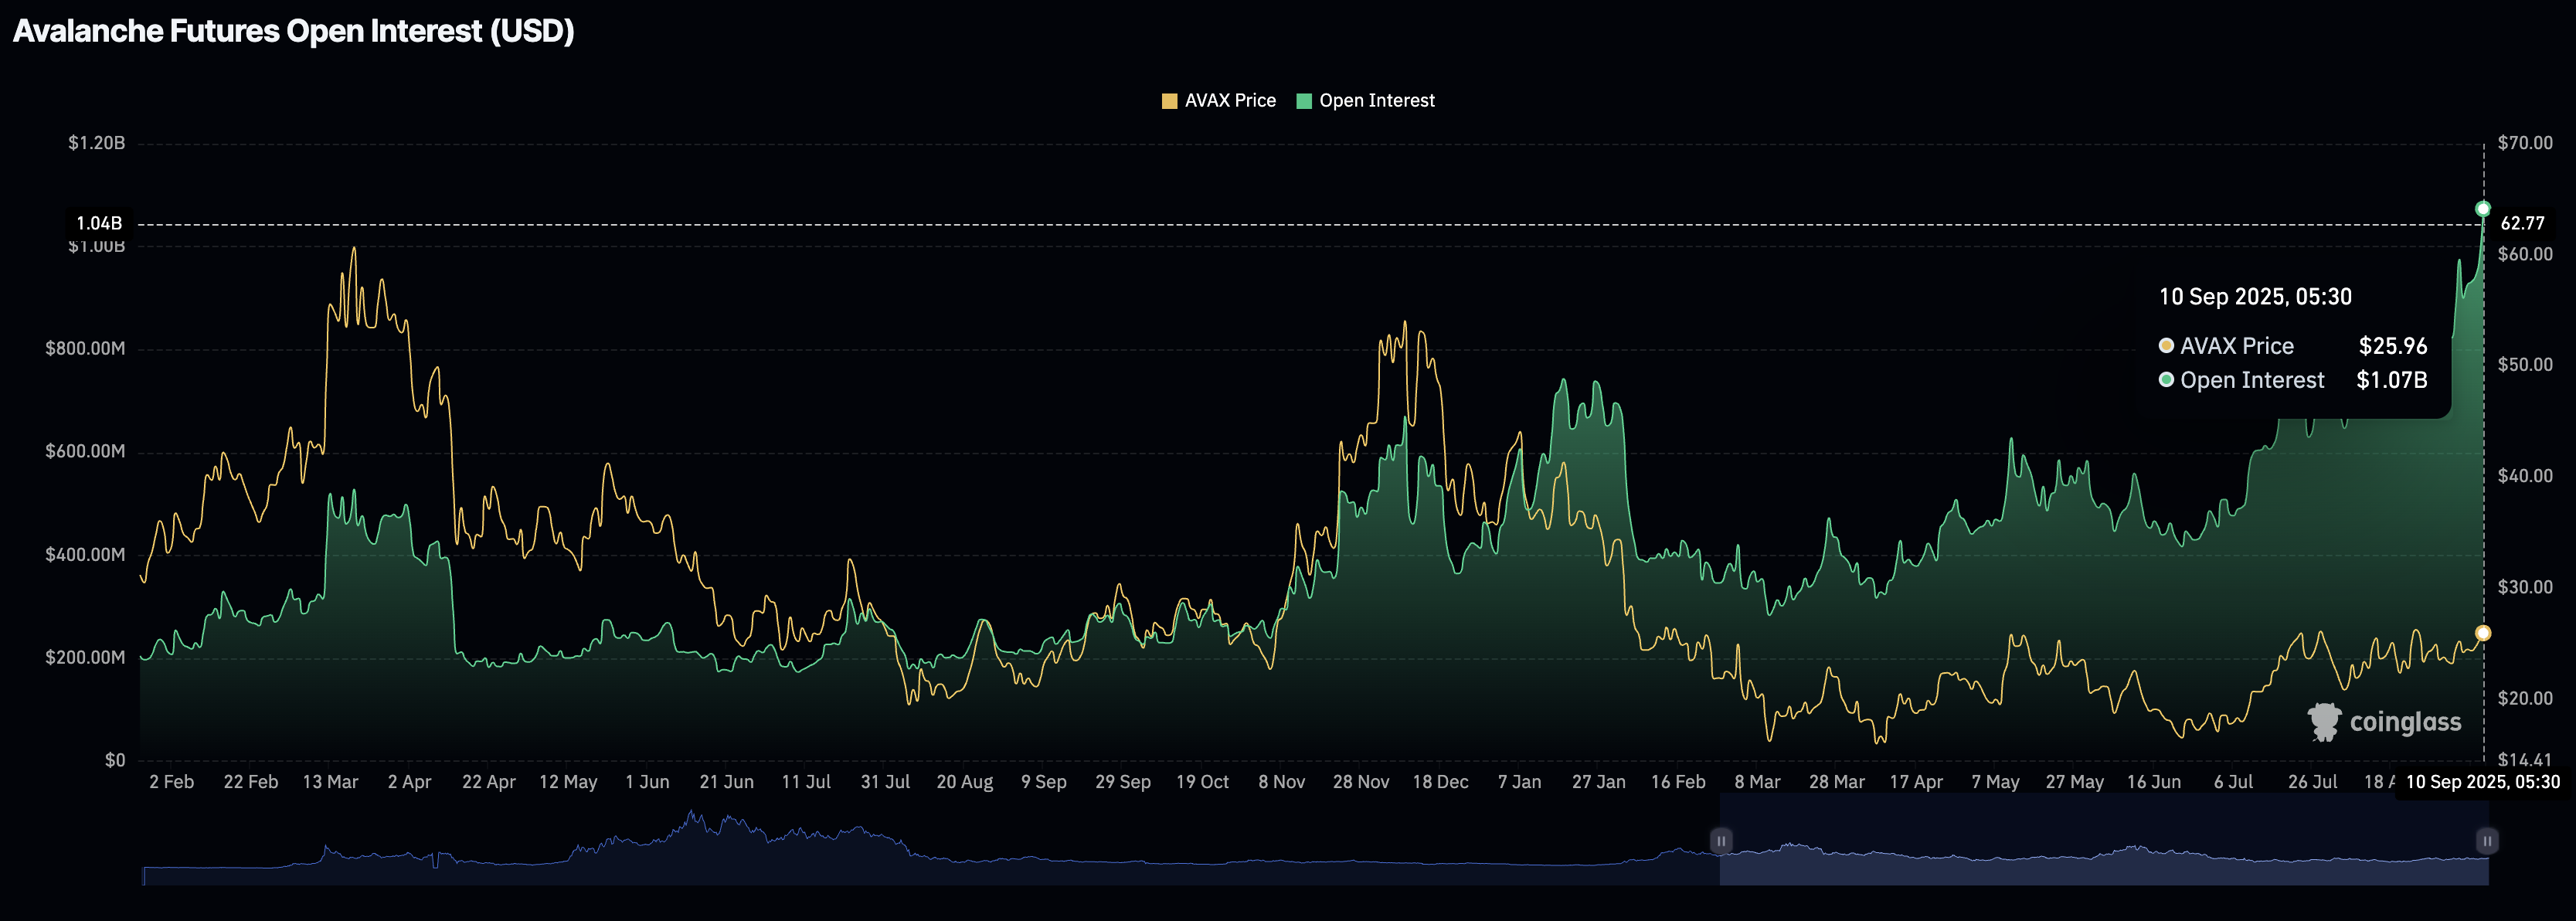
AVAX Open Interest. Source: CoinGlass
Avalanche targets a breakout rally to almost $30
AVAX holds a stable rise above $25 at press time on Wednesday, teasing a potential breakout of the supply zone between $25.75 and $26.50, marked as a yellow band on the daily chart shared below.
If the recovery run in this multi-chain token marks a decisive close above the R1 pivot level at $26.59, it could target the $29.78 mark, aligning with the R2 pivot level slightly under the $30.00 milestone.
Adding to the bullish potential, the 50-day Exponential Moving Average (EMA) crossed above the 200-day EMA, confirming a Golden Cross pattern. This indicates that the short-term recovery has overcome the influence of the prevailing trend, pointing to a bullish reversal.
Even the momentum indicators on the daily chart indicate increasing buying pressure as the Relative Strength Index (RSI) is at 61, pointing upwards with further room ahead before entering the overbought zone.
Additionally, the Moving Average Convergence Divergence (MACD) indicator displays green histogram bars on the same chart, indicating a rise in bullish momentum. The MACD line crossing above its signal line on Monday marked the trend reversal in Avalanche.
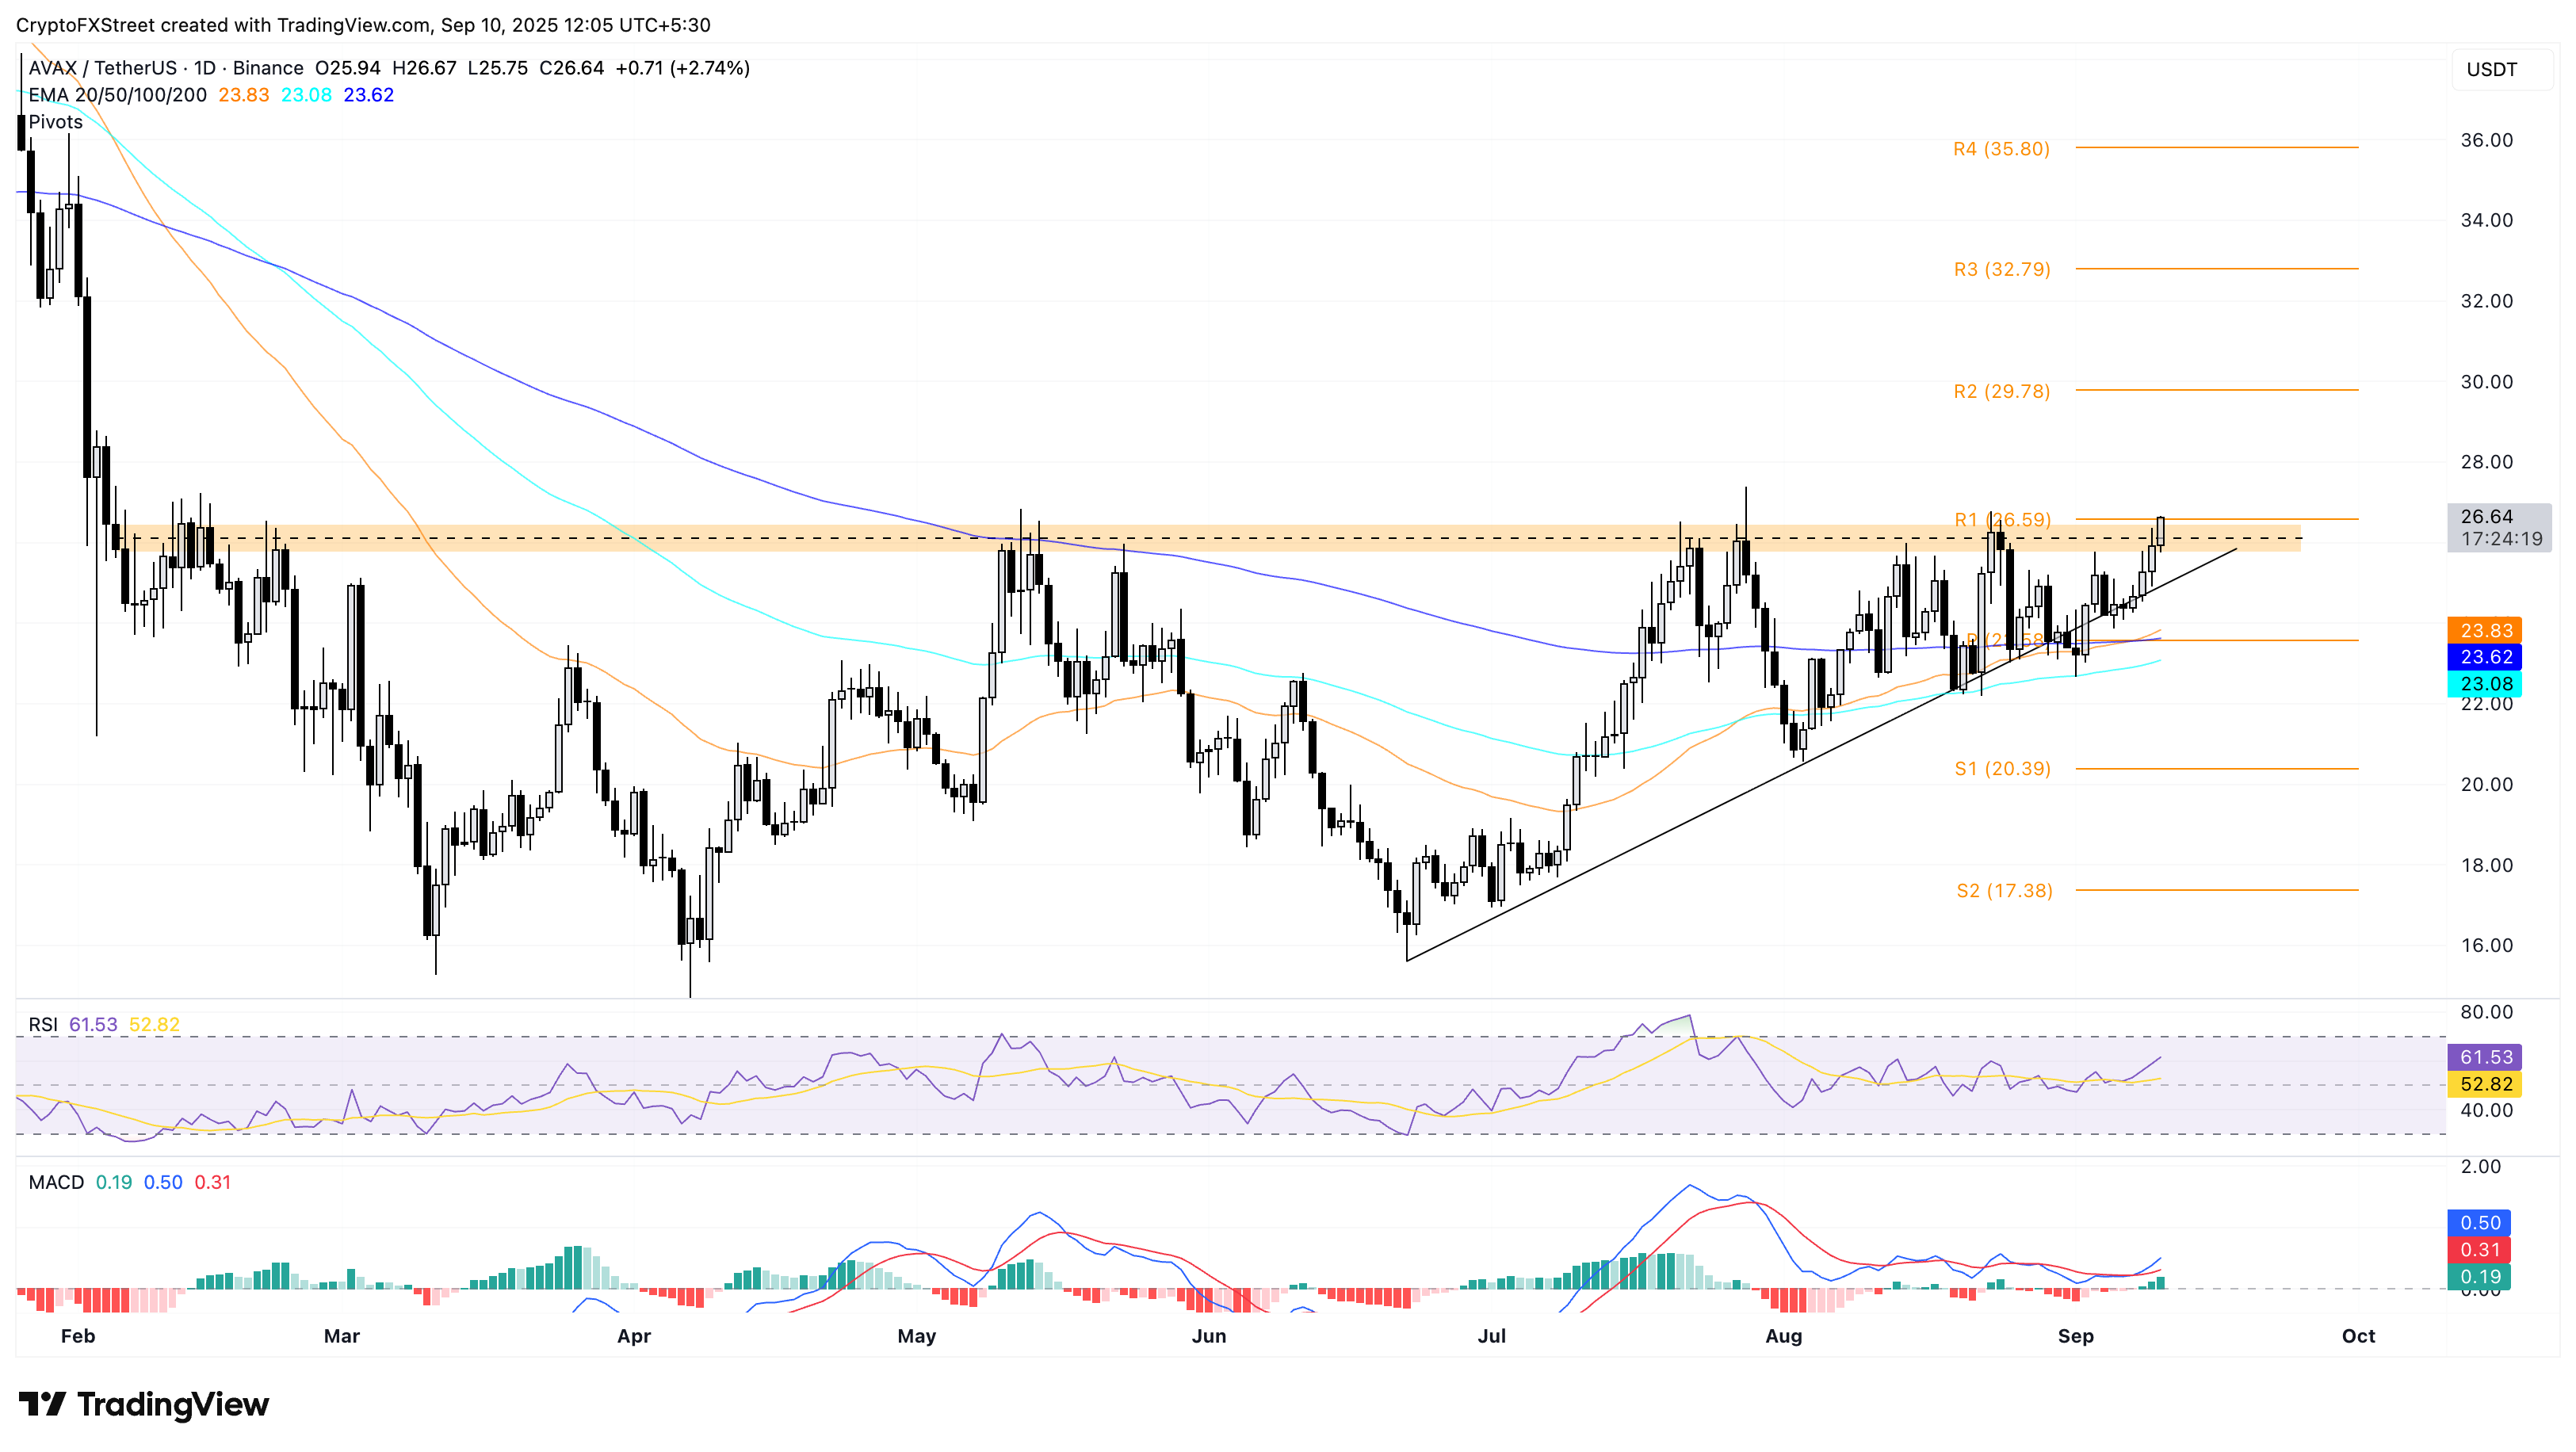
AVAX/USDT daily price chart.
On the contrary, if AVAX fails to uphold the intraday gains, it could reverse the trend to a local support trendline, formed by connecting the lows of June 22 and August 3 at $25.15.
Recommended Articles


