

Ethereum Price Forecast: ETH could pick up pace in Q4 amid cool-off in risk-on sentiment

Source Fxstreet

Ethereum price today: $4,470

  • Derive highlights Ethereum has potential for explosive growth in Q4 due to high institutional demand and rate cut expectations.
  • Despite strong institutional accumulation, risk-on sentiment surrounding ETH has cooled over the past week.
  • ETH is eyeing a recovery above $4,500 after it bounced off an ascending trendline support.

Ethereum's (ETH) price could see strong growth in Q4 due to rising institutional demand and expectations of rate cuts, according to Nick Forster, founder of crypto options exchange Derive. The prediction comes amid a range-bound movement in ETH over the past week.

Ethereum could gain momentum in Q4 despite decline in risk-on sentiment

Ethereum could see a strong Q4 following strong institutional accumulation and rising expectations of a rate cut, according to Forster.

"With rates expected to fall and institutions stockpiling ETH, markets are setting up for explosive potential heading into Q4," wrote Forster in a Wednesday note.

Over the past week, Ethereum exchange-traded funds (ETFs) expanded their holdings by 250,000 ETH, worth about $1.08 billion at the time, their fourth-best week since launching in July 2024. On top of that, strategic ETH reserve (SER) entities, led by BitMine Immersion (BMNR) and SharpLink Gaming (SBET), added 330,000 ETH last week to their cumulative balance, now valued at 3.6 million ETH.

"Institutional adoption of ETH is building serious momentum," noted Forster.

Meanwhile, expectations of a rate cut in the Federal Open Market Committee (FOMC) September meeting have stayed elevated above 90%, according to the CME FedWatch tool. The strong projection follows Fed Chair Jerome Powell's dovish hints at Jackson Hole on August 22. Historically, the crypto market has posted positive returns during periods of low interest rates.

"SERs now hold nearly 4% of the total ETH supply and are rapidly catching up to the 5.5% held by ETFs. With rates expected to decline, we could plausibly see SERs holding 6-10% of ETH's supply by year-end, positioning them as a major force behind ETH's price action," Forster added.

However, the recent market lull has cooled the strong risk-on sentiment that ETH saw in the majority of August.

Derive traders' projections of ETH hitting the $6,000 mark in October have dropped from 45% to 30% and expectations to reach the same figure by year-end are at 44%. ETH short-term volatility on the platform also declined from 75% to 65%.

Ethereum ETFs echo a similar sentiment, with investors triggering $300 million in net outflows in the past two trading days, according to SoSoValue data.

The decline in bullish momentum is more evident across CME futures contracts tracking ETH, as the top altcoin saw a notable basis contraction from 10% to 6.5% over the past week, according to a Tuesday report by K33 Research.

Ethereum Price Forecast: ETH bounces off trendline support, tests $4,500 key level

Ethereum experienced $56.7 million in futures liquidations in the past 24 hours, comprising $22.7 million and $34 million in long and short liquidations, per Coinglass data.

ETH bounced off a key ascending trendline support extending from June and is looking to test the resistance level near $4,500. If the top altcoin reclaims and holds $4,500 as support, it could retest the resistance near its all-time high at $4,956.
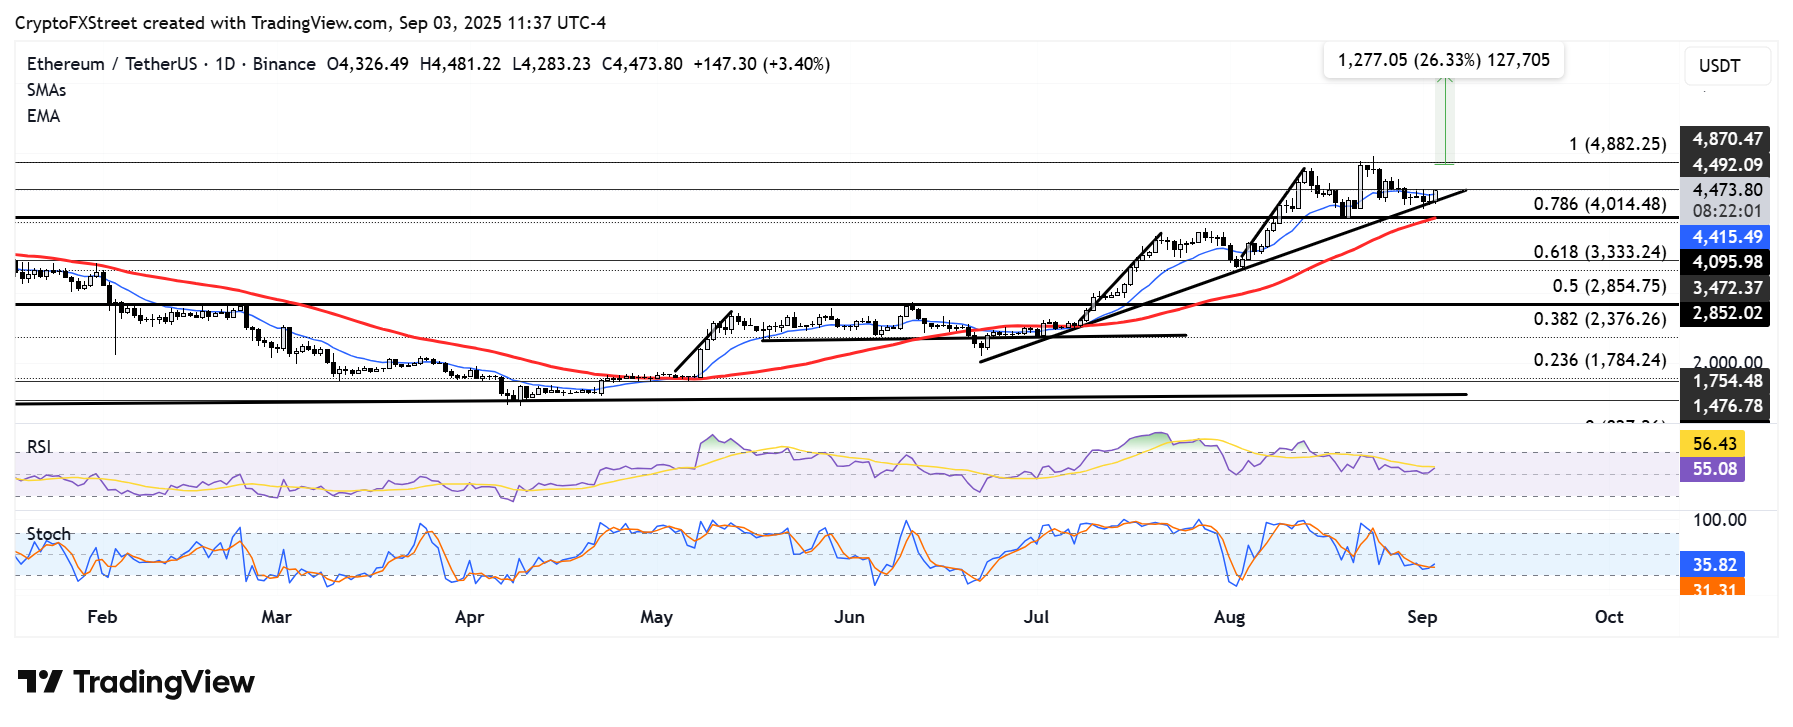
ETH/USDT daily chart

A firm cross above its all-time high will validate a bullish flag pattern and potentially push ETH above $6,000 — a level obtained by measuring the height of the flag's pole and projecting it upward from a potential breakout level.

The Relative Strength Index (RSI) edged slightly above its neutral level and is testing its moving average, while the Stochastic Oscillator (Stoch) remains below its midline. A firm cross above the moving average and the midline in both indicators, respectively, could mark the return of dominance in bullish momentum.

Disclaimer: For information purposes only. Past performance is not indicative of future results.
placeholder
Gold Price Analysis Today | Forex Gold Analysis | XAU/USD Analysis - November 11, 2026Get the latest gold price analysis, forex gold insights, and XAU/USD analysis for November 11, 2026. Read on for the details.
Author  Mitrade
Nov 11, Wed
Get the latest gold price analysis, forex gold insights, and XAU/USD analysis for November 11, 2026. Read on for the details.
placeholder
Nvidia slid 7.7% after hours while AMD and Broadcom rose — the AI trade changed hands, it didn't breakNvidia closed Wednesday at 173.73, up 2.87%, then fell as much as 8.1% to 159.44 after reports that its board was preparing for a possible leadership change. The same session, the Philadelphia Semiconductor Index rose 5.7% with all 30 components higher, CoreWeave jumped 24.7% on 168% revenue growth, and Micron added 11.9%. If AI demand were being repriced, AMD and Broadcom would not be bid. This is a governance discount on one name, and 204.54 — the 200-day average — is the level that settles it.
Author  Irene Q.
Nov 12, Thu
Nvidia closed Wednesday at 173.73, up 2.87%, then fell as much as 8.1% to 159.44 after reports that its board was preparing for a possible leadership change. The same session, the Philadelphia Semiconductor Index rose 5.7% with all 30 components higher, CoreWeave jumped 24.7% on 168% revenue growth, and Micron added 11.9%. If AI demand were being repriced, AMD and Broadcom would not be bid. This is a governance discount on one name, and 204.54 — the 200-day average — is the level that settles it.
placeholder
US October PPI Preview: Fed Rate Hike Expectations Rise, PPI May Be Key Variable; How Will US Stocks, Dollar, and Gold Move?On Friday (Nov. 13) Eastern Time, the U.S. will release the October Producer Price Index (PPI). Following the October CPI once again exceeding expectations, the market will look to the PP
Author  TradingKey
Nov 12, Thu
On Friday (Nov. 13) Eastern Time, the U.S. will release the October Producer Price Index (PPI). Following the October CPI once again exceeding expectations, the market will look to the PP
placeholder
Gold hit a one-year low while central banks bought 321 tonnes — the sellers were never the ones you thinkSpot gold closed at 3,876 on Thursday, down 2.8% and its lowest close in more than a year, with an intraday low near 3,852. The dollar is at a 19-month high of 103.21 and the 10-year yield is at 5.10%, so the price move is easy to explain. What is harder to explain is who sold: central banks bought 321 tonnes in Q3, the PBoC added for a 24th straight month, ETF holdings are near a record 4,256 tonnes, and roughly 95% of the futures selling came from non-reportable and sovereign-type accounts rather than hedge funds. This piece separates the two books that have to balance.
Author  Irene Q.
Yesterday 02: 40
Spot gold closed at 3,876 on Thursday, down 2.8% and its lowest close in more than a year, with an intraday low near 3,852. The dollar is at a 19-month high of 103.21 and the 10-year yield is at 5.10%, so the price move is easy to explain. What is harder to explain is who sold: central banks bought 321 tonnes in Q3, the PBoC added for a 24th straight month, ETF holdings are near a record 4,256 tonnes, and roughly 95% of the futures selling came from non-reportable and sovereign-type accounts rather than hedge funds. This piece separates the two books that have to balance.
placeholder
Brent rose 3.3% and US crude stocks built 4.66 million barrels in the same weekBrent January settled at 95.82, up 3.3%, and WTI at 88.74, up 2.55%, after the US signalled it would not pursue a deal with Iran and attacks on Gulf shipping continued. In the same week, EIA data showed US crude inventories rising 4.657 million barrels against expectations of a 1.1 million draw, with gasoline up another 1.799 million. OPEC output also rebounded 1.96 million barrels a day to 27.16 million in October, led by Saudi Arabia at 10.56 million. This piece separates the geopolitical premium from the physical balance and lays out where each side of the trade is anchored.
Author  Irene Q.
Yesterday 03: 06
Brent January settled at 95.82, up 3.3%, and WTI at 88.74, up 2.55%, after the US signalled it would not pursue a deal with Iran and attacks on Gulf shipping continued. In the same week, EIA data showed US crude inventories rising 4.657 million barrels against expectations of a 1.1 million draw, with gasoline up another 1.799 million. OPEC output also rebounded 1.96 million barrels a day to 27.16 million in October, led by Saudi Arabia at 10.56 million. This piece separates the geopolitical premium from the physical balance and lays out where each side of the trade is anchored.
Related Instrument
goTop
quote