

Crypto Bull Run Dead? Analyst Says The Real Top Isn’t Here Yet

Source Newsbtc

Top analyst Miles Deutscher says the crypto market’s apparent fatigue is being misread. In a new video titled “Why The Crypto Bull Run Is Far From Over (Data Says This Happens Next),” the commentator—who has more than 630,000 followers on X—argues that both macro and market-structure signals point to an extended cycle, with Ethereum poised to lead even if Bitcoin cools.

Crypto Cycle Dead?

Deutscher opens by cutting against a swelling narrative that Bitcoin “has potentially put in a top,” acknowledging that spot price action “objectively looks quite weak at the moment.” Yet, he stresses, “I don’t believe the cycle is over,” and lays out what he considers the telltale sign of a real top—one that he says has not materialized.

On the shorter time frame, he notes BTC slipped below a channel low but is attempting to reclaim the mid-range, highlighting a near-term “bearish retest at the H4 money noodle.” He calls the $111.5k area a line in the sand, with a push and hold back above ~$114k needed to repair structure. For clarity, he describes his “noodle” as a custom moving-average style trend gauge: “just our custom indicator which is basically a moving average.”
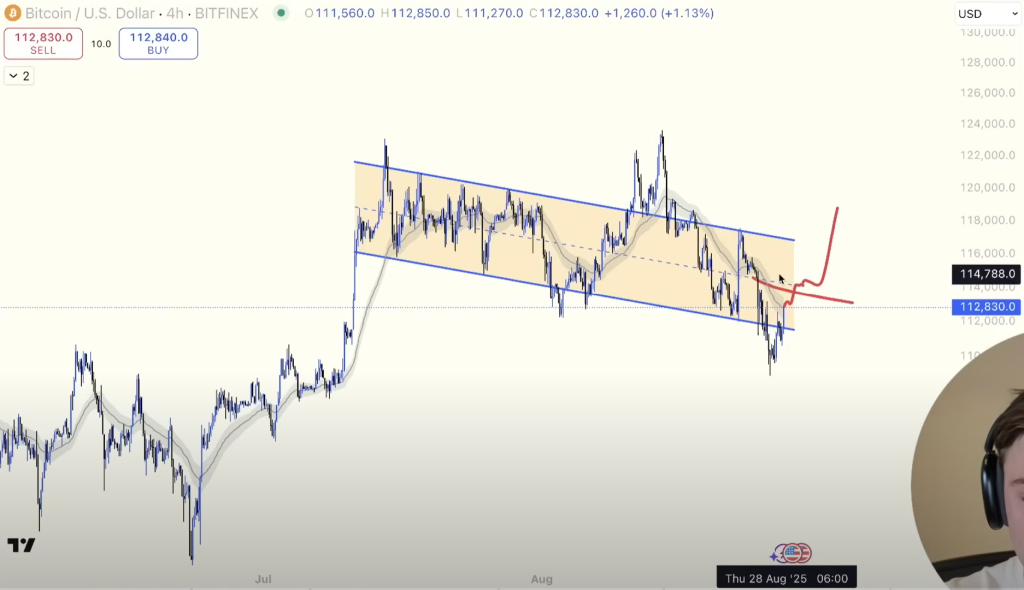
BTC broke below the channel

Where Bitcoin looks “a little bit toppy,” Deutscher says Ethereum’s daily structure “paints a very different picture.” ETH, he argues, is showing a classic compression beneath major resistance around its prior all-time high while “grinding above the money noodle,” a configuration he believes sets up “the next expansive leg to the upside” if the daily trend base is maintained.

A central plank of his thesis is the cycle’s alignment with broader risk indicators. Reading from a post by trader Nik (@cointradernik), he underscores that several risk-on ratios look like they are bottoming, not topping—US micro caps versus small caps, emerging markets versus the FTSE 100, ARK-style growth versus gold—suggesting the business cycle is still advancing rather than rolling over.

In that context, Deutscher contends it would be unusual for crypto to peak now unless it consciously decoupled from equities. He further frames a policy backdrop he sees as supportive, pointing to political rhetoric favorable to crypto assets and the prospect of rate cuts later this year; he characterizes the current market “jitteriness” as a function of timing uncertainty rather than a structural turn.

He also revisits Bitcoin’s higher-time-frame rhythm since 2023 as a sequence of “rally-base-rally” phases with recurring retests of a weekly trend marker. In that pattern, he argues, even a drop toward ~$100,000 would be a textbook bull-market pullback, not a terminal break, especially given what he calls today’s comparatively modest extension above long-term averages versus 2021 and late-2024. “Anyone whose view is that Bitcoin has topped for the cycle here at $124,000 will be deeply disappointed in the relative shallowness of this correction,” he says, asserting that distance to key moving averages leaves less room for a deep retrace.
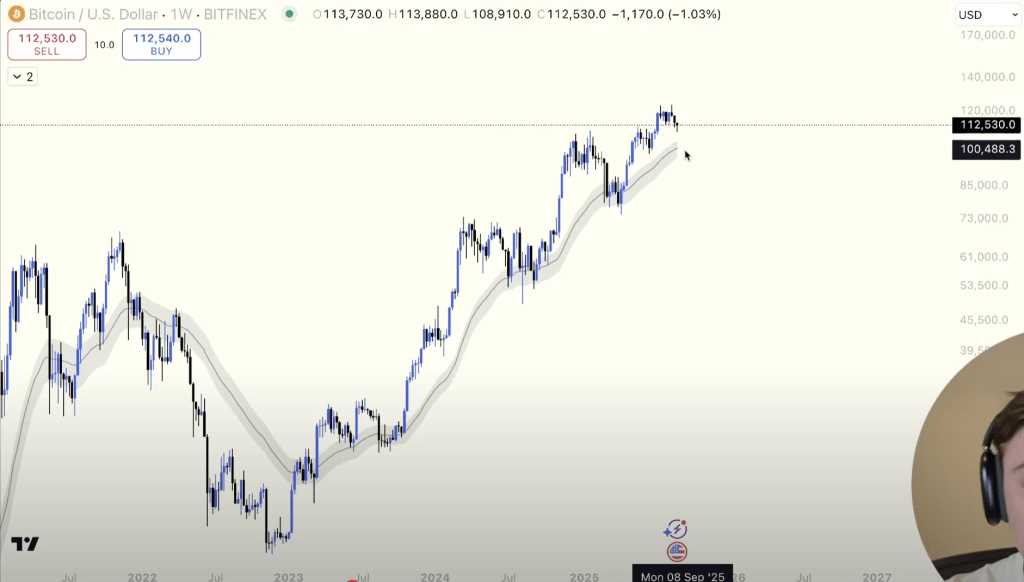
Bitcoin could dip towards $100,000

The Altcoin Rotation

The most controversial—and for crypto traders, arguably the most consequential—part of Deutscher’s analysis is historical altcoin rotation. He says prior cycles show that Ethereum often does its strongest work after Bitcoin tops. “In 2017 Bitcoin topped and traded 47% lower as Ethereum rallied 100% higher in the next 30 days,” he claims. “In 2021, Bitcoin topped [and] went 27% lower as ETH rallied…83% higher in the next 30 days.”

While he is not declaring a BTC top now, he argues the crypto market is already exhibiting a “decoupling” in which ETH and other altcoins are grinding higher against BTC even as Bitcoin softens—proof, in his view, that “using Bitcoin as your ultimate bull-market indicator” for alts can be misleading when Ethereum’s structure is this strong.

That view informs his positioning. Rather than longing Bitcoin at support, he says he’s increasingly using BTC dips as “confluence to take a trade on Ethereum because I think Ethereum outperforms from here on out.” On camera, he disclosed a growing ETH long in a public “fun trading account,” while emphasizing that “most people would be better off sticking mostly to spot” and that any use of leverage should be small, deliberate and within strict risk parameters. “There were many times where I’ve screwed up by being over-leveraged,” he cautions.

Beyond trade setup and crypto cycle theory, Deutscher returns to his original premise: a genuine cycle top generally coincides with a topping business cycle, deteriorating breadth in risk assets, and blow-off dynamics he says are absent today. Summarizing his stance, he concludes that neither Bitcoin nor altcoins have topped “due to where we are in the business cycle,” and even if BTC does mark a high sooner than he expects, “I wouldn’t necessarily take that as the ultimate bear signal for ETH and alts.”

At press time, BTC traded at $113,028.
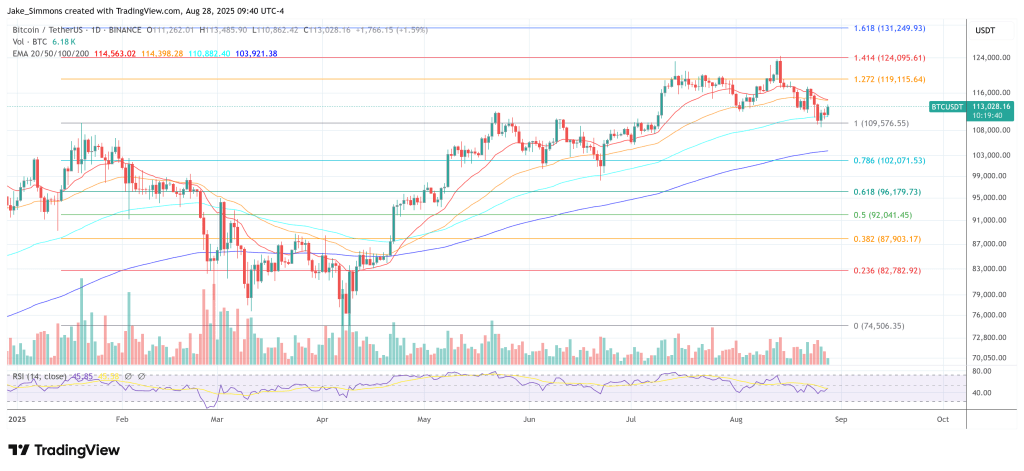
Bitcoin price
Disclaimer: For information purposes only. Past performance is not indicative of future results.
placeholder
Nvidia slid 7.7% after hours while AMD and Broadcom rose — the AI trade changed hands, it didn't breakNvidia closed Wednesday at 173.73, up 2.87%, then fell as much as 8.1% to 159.44 after reports that its board was preparing for a possible leadership change. The same session, the Philadelphia Semiconductor Index rose 5.7% with all 30 components higher, CoreWeave jumped 24.7% on 168% revenue growth, and Micron added 11.9%. If AI demand were being repriced, AMD and Broadcom would not be bid. This is a governance discount on one name, and 204.54 — the 200-day average — is the level that settles it.
Author  Irene Q.
Nov 12, Thu
Nvidia closed Wednesday at 173.73, up 2.87%, then fell as much as 8.1% to 159.44 after reports that its board was preparing for a possible leadership change. The same session, the Philadelphia Semiconductor Index rose 5.7% with all 30 components higher, CoreWeave jumped 24.7% on 168% revenue growth, and Micron added 11.9%. If AI demand were being repriced, AMD and Broadcom would not be bid. This is a governance discount on one name, and 204.54 — the 200-day average — is the level that settles it.
placeholder
Gold hit a one-year low while central banks bought 321 tonnes — the sellers were never the ones you thinkSpot gold closed at 3,876 on Thursday, down 2.8% and its lowest close in more than a year, with an intraday low near 3,852. The dollar is at a 19-month high of 103.21 and the 10-year yield is at 5.10%, so the price move is easy to explain. What is harder to explain is who sold: central banks bought 321 tonnes in Q3, the PBoC added for a 24th straight month, ETF holdings are near a record 4,256 tonnes, and roughly 95% of the futures selling came from non-reportable and sovereign-type accounts rather than hedge funds. This piece separates the two books that have to balance.
Author  Irene Q.
Nov 13, Fri
Spot gold closed at 3,876 on Thursday, down 2.8% and its lowest close in more than a year, with an intraday low near 3,852. The dollar is at a 19-month high of 103.21 and the 10-year yield is at 5.10%, so the price move is easy to explain. What is harder to explain is who sold: central banks bought 321 tonnes in Q3, the PBoC added for a 24th straight month, ETF holdings are near a record 4,256 tonnes, and roughly 95% of the futures selling came from non-reportable and sovereign-type accounts rather than hedge funds. This piece separates the two books that have to balance.
placeholder
Brent rose 3.3% and US crude stocks built 4.66 million barrels in the same weekBrent January settled at 95.82, up 3.3%, and WTI at 88.74, up 2.55%, after the US signalled it would not pursue a deal with Iran and attacks on Gulf shipping continued. In the same week, EIA data showed US crude inventories rising 4.657 million barrels against expectations of a 1.1 million draw, with gasoline up another 1.799 million. OPEC output also rebounded 1.96 million barrels a day to 27.16 million in October, led by Saudi Arabia at 10.56 million. This piece separates the geopolitical premium from the physical balance and lays out where each side of the trade is anchored.
Author  Irene Q.
Nov 13, Fri
Brent January settled at 95.82, up 3.3%, and WTI at 88.74, up 2.55%, after the US signalled it would not pursue a deal with Iran and attacks on Gulf shipping continued. In the same week, EIA data showed US crude inventories rising 4.657 million barrels against expectations of a 1.1 million draw, with gasoline up another 1.799 million. OPEC output also rebounded 1.96 million barrels a day to 27.16 million in October, led by Saudi Arabia at 10.56 million. This piece separates the geopolitical premium from the physical balance and lays out where each side of the trade is anchored.
placeholder
Anthropic is six times oversubscribed at $1.4 trillion while Nvidia is down 32% — the AI trade has two pricesAnthropic lists on Nasdaq as ANT on Thursday at $70 ~ $78 a share, raising up to $64.4 billion at a target valuation near $1.4 trillion, and the book is reportedly six times covered. In the same six weeks, Nvidia has fallen 32% and the QQQ is 10.9% below its October peak. Private capital and public markets are marking the same AI complex at two very different prices. This piece separates the two books: what the S-1 shows, who is anchoring the $26 billion private placement, and what Thursday's debut would have to do to change the public tape.
Author  Irene Q.
7 hours ago
Anthropic lists on Nasdaq as ANT on Thursday at $70 ~ $78 a share, raising up to $64.4 billion at a target valuation near $1.4 trillion, and the book is reportedly six times covered. In the same six weeks, Nvidia has fallen 32% and the QQQ is 10.9% below its October peak. Private capital and public markets are marking the same AI complex at two very different prices. This piece separates the two books: what the S-1 shows, who is anchoring the $26 billion private placement, and what Thursday's debut would have to do to change the public tape.
placeholder
Gold Price Analysis Today | Forex Gold Analysis | XAU/USD Analysis - November 16, 2026Get the latest gold price analysis, forex gold insights, and XAU/USD analysis for November 16, 2026. Read on for the details.
Author  Mitrade
7 hours ago
Get the latest gold price analysis, forex gold insights, and XAU/USD analysis for November 16, 2026. Read on for the details.
goTop
quote