
Hyperliquid Price Forecast: HYPE rebounds as TVL hits record high, chain fees surpass Ethereum, Tron
- Hyperliquid price gains over 4% on Tuesday after retesting its key support the previous day.
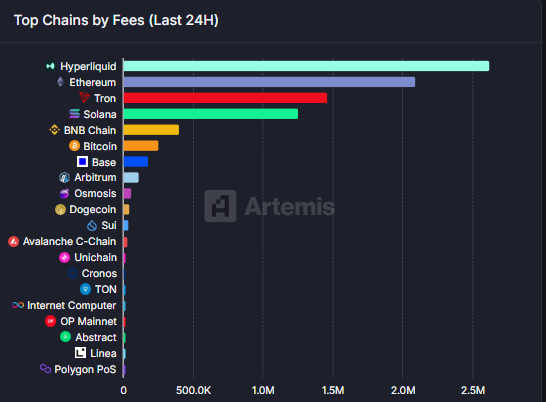
- Artemis Terminal data shows that Hyperliquid’s 24-hour chain fees surpass both Ethereum and Tron, signaling strong network activity.
- Figures highlight that HYPE TVL hits a record high and bullish bets rise, signaling bullish sentiment.
Hyperliquid (HYPE) post gains over 4% trading above $44 at the time of writing on Tuesday, after finding support around a key zone the previous day. The upward trend strengthens as HYPE’s Total Value Locked (TVL) hits a record high, while bullish bets reach a monthly high. Moreover, Artemis Terminal highlights that the network’s 24-hour chain fees have surpassed those of Ethereum (ETH) and Tron (TRX), underscoring growing adoption and activity.
HYPE fees collection surpasses ETH and TRX
According to Artemis Terminal data, Hyperliquid’s 24-hour chain fees collection is $2.6 million, topping the list of other networks such as Ethereum and Tron, indicating a growing interest among traders and liquidity in the HYPE chain.
Additionally, Artemis Terminal data shows that Hyperliquid’s TVL has increased to a new all-time high of $2.3 billion on Tuesday. Rising TVL indicates growing activity and interest within HYPE’s ecosystem, suggesting that more users are depositing or utilizing assets within HYPE-based protocols.
-1756193137733-1756193137735.jpeg)
HYPE TVL chart. Source: Artemis Terminal
Coinglass’s long-to-short ratio of HYPE further supports the bullish outlook. The ratio currently stands at 1.20, the highest level over a month, indicating traders are betting on the asset price to rally.
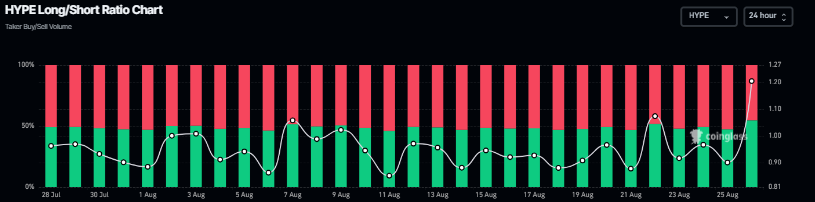
Hyperliquid long-to-short ratio chart. Source: Coinglass
Hyperliquid Price Forecast: Bulls aiming for record highs
Hyperliquid price found support around the ascending trendline (drawn by connecting multiple lows since early April) on Thursday and rose 13.88% over the next three days, closing above its 50-day Exponential Moving Average (EMA) at $42.44. However, on Monday, it faced a correction of 6.6% and retested the 50-day EMA. At the time of writing on Tuesday, it rebounded over 4% trading around $44.87.
If the 50-day EMA at $42.44 continues to hold as support, HYPE could extend the rally toward its all-time high of $49.88.
The Relative Strength Index (RSI) on the daily chart reads 52, rebounding from its neutral level of 50 on Monday and points upwards, indicating bullish momentum gaining traction. The Moving Average Convergence Divergence (MACD) indicator lines coil against each other, suggesting indecisiveness among traders.
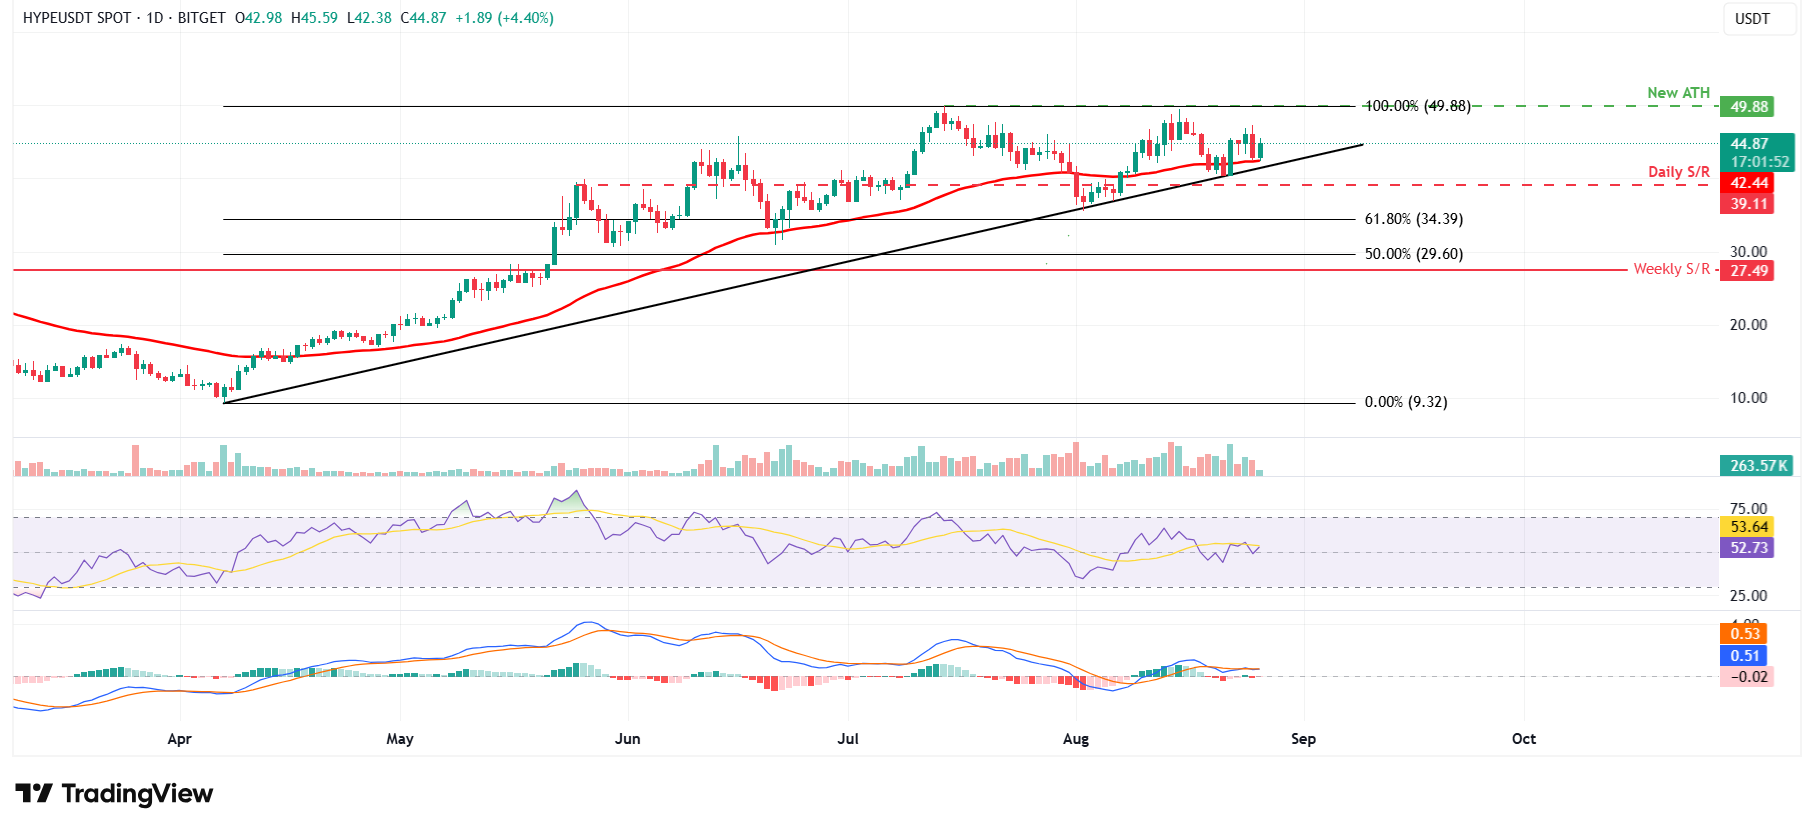
HYPE/USDT daily chart
However, if HYPE closes below its 50-day EMA at $42.44, it could extend the decline toward its daily support at $39.11.
Recommended Articles


