

Cardano Price Squeezed Between Support And Resistance – Market Awaits Next Leg

Source Newsbtc

Cardano’s price is caught in a tight range, holding above key support while facing resistance overhead. With momentum weakening, will ADA break higher or slide back toward lower levels in its next decisive move?

Bearish AB=CD Pattern Completed With Rejection At $0.95

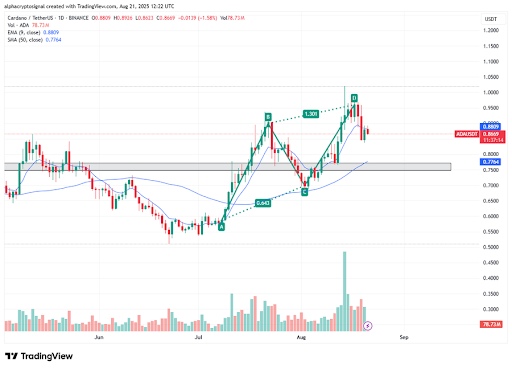
Alpha Crypto Signal, a crypto analyst on X, recently shared insights on Cardano’s price action, noting that ADA has just completed a bearish AB=CD pattern on the daily timeframe. The rejection around the $0.95 level confirms this setup, suggesting that the market may be preparing for a corrective move. Such harmonic patterns often signal exhaustion in the preceding trend, hinting that ADA could face additional downward pressure in the short term.

Currently, Cardano is trading below the 9-day EMA at $0.88, indicating that momentum has weakened following its recent attempts to push higher. Trading beneath this moving average often reflects a bearish shift in sentiment, where buyers struggle to maintain control. 
Cardano

The analyst highlighted a critical support zone between $0.74 and $0.77, which will likely act as the first line of defense for bulls. Should this area give way, ADA could extend its decline toward the $0.70–$0.68 range, marking a deeper retracement and potentially testing the patience of long-term holders. 

Still, the outlook is not entirely bearish. According to the analysis, bulls could regain momentum if ADA manages to reclaim the $0.90 level and establish support above it. A successful recovery beyond this threshold would weaken the bearish narrative and possibly set the stage for another upward push.

Cardano Holds Key Level After Pullback

CryptoPulse, another market analyst, noted in an X update that Cardano is currently holding above a key support level following a pullback. This resilience suggests that buyers are still defending critical price zones despite recent bearish pressure.

Related Reading: Cardano Defies Market Pullback: Could On-Chain Momentum Signal a 70% Run Ahead?

According to the analyst, as long as the price maintains this support just above $0.80, ADA has the potential to rebound toward the $1.06 region, which aligns with the 0.382 Fibonacci retracement level. A move in this direction would indicate that momentum is shifting back in favor of the bulls.

However, CryptoPulse cautioned that if support fails and ADA breaks lower, a backtest could occur, raising the risk of the price revisiting its range lows. Such a move would reinforce bearish sentiment and potentially delay any significant recovery attempts.

In the meantime, the levels are clearly defined, leaving the market to decide its next direction. Whether ADA manages to build on its current support and push higher, or slips back into deeper corrective territory, will depend on how traders respond around these pivotal zones.

Cardano
Disclaimer: For information purposes only. Past performance is not indicative of future results.
placeholder
The Fed will sit still on October 28 — but 100 of 100 economists now expect a December hikeA Reuters poll run October 16-20 found 94 of 100 economists expecting the Fed to hold at 3.75-4.00% on October 28 — and all 100 expecting a hike in December, against less than half a month earlier. The market is close to the same price, with CME FedWatch at roughly 17% for October and 82.8% for December. With the Fed in blackout since October 17, here are the five dates that decide the rest of the year, what each one is priced for, and the two directions each can take.
Author  Irene Q.
Oct 22, Thu
A Reuters poll run October 16-20 found 94 of 100 economists expecting the Fed to hold at 3.75-4.00% on October 28 — and all 100 expecting a hike in December, against less than half a month earlier. The market is close to the same price, with CME FedWatch at roughly 17% for October and 82.8% for December. With the Fed in blackout since October 17, here are the five dates that decide the rest of the year, what each one is priced for, and the two directions each can take.
placeholder
Gold Price Analysis Today | Forex Gold Analysis | XAU/USD Analysis - October 26, 2026Get the latest gold price analysis, forex gold insights, and XAU/USD analysis for October 26, 2026. Read on for the details.
Author  Mitrade
Yesterday 01: 52
Get the latest gold price analysis, forex gold insights, and XAU/USD analysis for October 26, 2026. Read on for the details.
placeholder
Big Tech's $800 billion AI bill faces its first real test — free cash flow is the judgeAlphabet and Microsoft report after the close on October 28, Amazon on October 29, with hyperscaler AI capex running near $800 billion a year. Meta's negative free cash flow and 9.40% drop on October 22 was the warning; this week's prints decide whether cloud growth and backlog can pay for the buildout. Here are the consensus numbers, the free-cash-flow table and the two-sided test.
Author  Irene Q.
Yesterday 05: 32
Alphabet and Microsoft report after the close on October 28, Amazon on October 29, with hyperscaler AI capex running near $800 billion a year. Meta's negative free cash flow and 9.40% drop on October 22 was the warning; this week's prints decide whether cloud growth and backlog can pay for the buildout. Here are the consensus numbers, the free-cash-flow table and the two-sided test.
placeholder
Gold breaks $4,000 as oil becomes the inflation problem — $3,943 is the line that mattersSpot gold closed at $3,995.6 on October 23, down about 4.1% for the week and at its lowest since mid-July, and traded near $3,988 on October 26 even as Brent crude settled at $116.72 and Middle East supply risk stayed elevated. The war premium stopped working because oil is now the inflation trade: December Fed hike odds are 68.9% and the 10-year yield is 4.988%. Here are the three numbers, the transmission chain, and the July low at $3,943 that decides whether this is a bottom or a bigger correction.
Author  Irene Q.
Yesterday 06: 41
Spot gold closed at $3,995.6 on October 23, down about 4.1% for the week and at its lowest since mid-July, and traded near $3,988 on October 26 even as Brent crude settled at $116.72 and Middle East supply risk stayed elevated. The war premium stopped working because oil is now the inflation trade: December Fed hike odds are 68.9% and the 10-year yield is 4.988%. Here are the three numbers, the transmission chain, and the July low at $3,943 that decides whether this is a bottom or a bigger correction.
placeholder
Bitcoin Price Forecast: Drops Below $80,000 in Fifth Straight Loss, May Test $75,000 as FOMC Meeting Approaches Bitcoin falls below the $80,000 mark as the October FOMC decision approaches, threatening a further dip toward $75,000.On October 26, Bitcoin (BTC) again lost the key psychological mark o
Author  TradingKey
Yesterday 10: 10
Bitcoin falls below the $80,000 mark as the October FOMC decision approaches, threatening a further dip toward $75,000.On October 26, Bitcoin (BTC) again lost the key psychological mark o
goTop
quote