

Silver Price Forecast: XAG/USD surges above $30.00 amid high US yields, strong USD
- Silver climbs 0.80% to $30.35, outstripping concerns over U.S. inflation, Fed scrutiny.
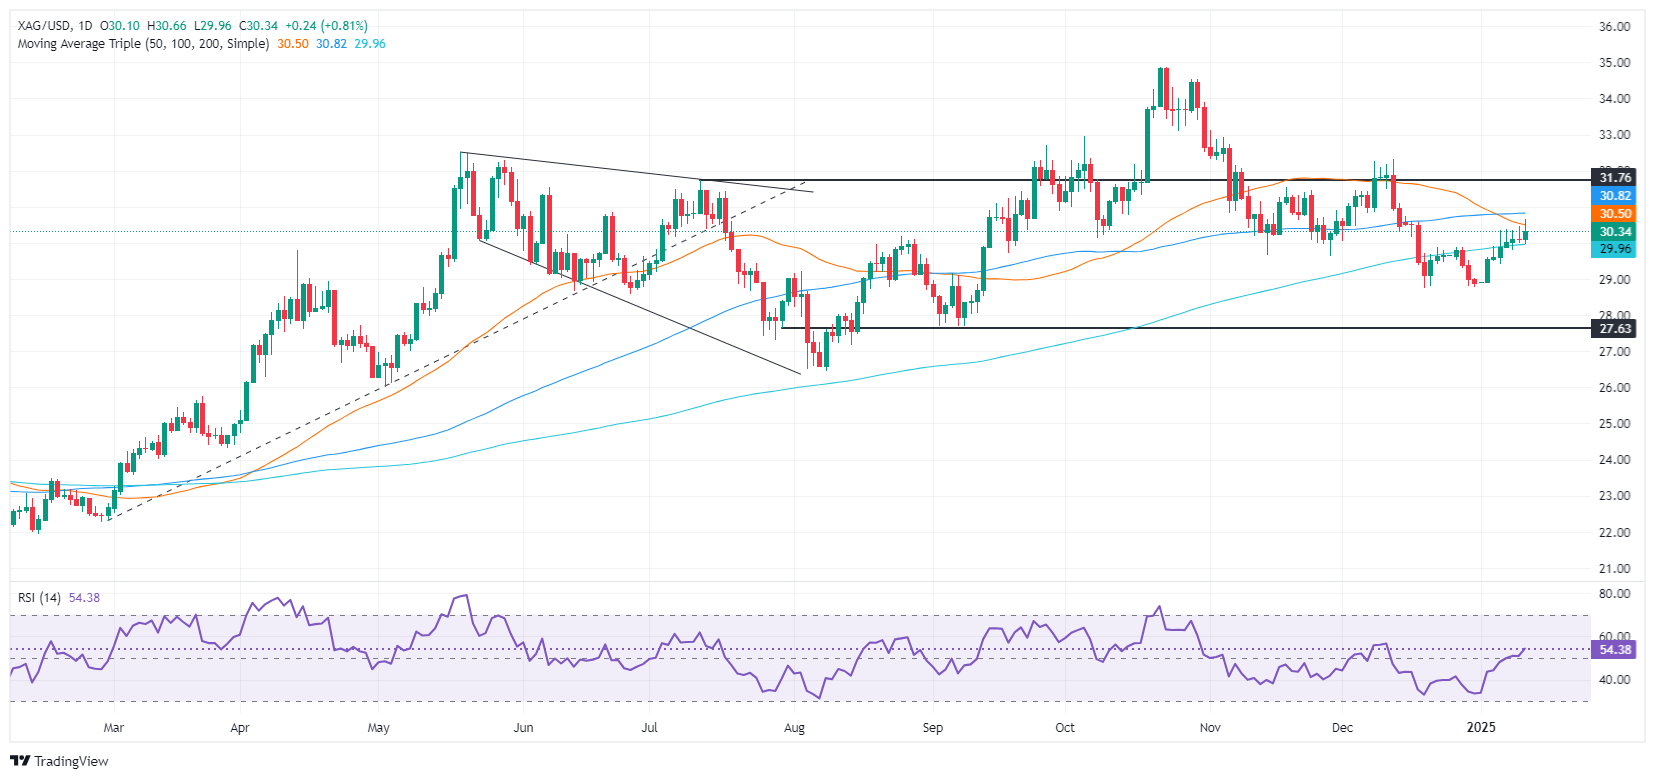
- Technical hurdle at 50-day SMA of $30.42; breach could push silver to $30.80.
- Downside risks if silver drops below $30.00, key support at 200-day SMA, lows near $28.78.
Silver Price rises for the seven straight day putting aside the jump in US Treasury bond yields and the US Dollar, after a strong US jobs report calmed Federal Reserve officials about the employment situation in the US. Nevertheless, the evolution on inflation seems to be stalled, gathering some attention of Fed oficials. The XAG/USD trades at $30.35 up over 0.80%.
XAG/USD Price Forecast: Technical outlook
Silver continues to trend higher, advancing steadily above the $30.00 figure for the latest fhree trading days, boosted by buyers emerging at crucial support found at the 200-day Simple Moving Average (SMA) at $29.93. However, they are struggling with stir resistance at the 50-day SMA at $30.42, which has kept prices from reaching the 100-day SMA at $30.80.
If bulls clear those levels, that will clear the path to challenge $31.00 and expose the next cycle high seen at $32.32, December’s 12 peak.
Conversely, if XAG/USD slides beneath $30.00, the 200-day SMA emerges as bulls’ first line of defense. A breach of that level, could drive Silver’s price towards the January 6 low of $29.41, ahead of the December 31 low of $28.78.
XAG/USD Price Chart – Daily
Silver FAQs
Silver is a precious metal highly traded among investors. It has been historically used as a store of value and a medium of exchange. Although less popular than Gold, traders may turn to Silver to diversify their investment portfolio, for its intrinsic value or as a potential hedge during high-inflation periods. Investors can buy physical Silver, in coins or in bars, or trade it through vehicles such as Exchange Traded Funds, which track its price on international markets.
Silver prices can move due to a wide range of factors. Geopolitical instability or fears of a deep recession can make Silver price escalate due to its safe-haven status, although to a lesser extent than Gold's. As a yieldless asset, Silver tends to rise with lower interest rates. Its moves also depend on how the US Dollar (USD) behaves as the asset is priced in dollars (XAG/USD). A strong Dollar tends to keep the price of Silver at bay, whereas a weaker Dollar is likely to propel prices up. Other factors such as investment demand, mining supply – Silver is much more abundant than Gold – and recycling rates can also affect prices.
Silver is widely used in industry, particularly in sectors such as electronics or solar energy, as it has one of the highest electric conductivity of all metals – more than Copper and Gold. A surge in demand can increase prices, while a decline tends to lower them. Dynamics in the US, Chinese and Indian economies can also contribute to price swings: for the US and particularly China, their big industrial sectors use Silver in various processes; in India, consumers’ demand for the precious metal for jewellery also plays a key role in setting prices.
Silver prices tend to follow Gold's moves. When Gold prices rise, Silver typically follows suit, as their status as safe-haven assets is similar. The Gold/Silver ratio, which shows the number of ounces of Silver needed to equal the value of one ounce of Gold, may help to determine the relative valuation between both metals. Some investors may consider a high ratio as an indicator that Silver is undervalued, or Gold is overvalued. On the contrary, a low ratio might suggest that Gold is undervalued relative to Silver.
Recommended Articles


