

Silver Price Forecast: XAG/USD climbs above $30.00, treks up along nine-day EMA
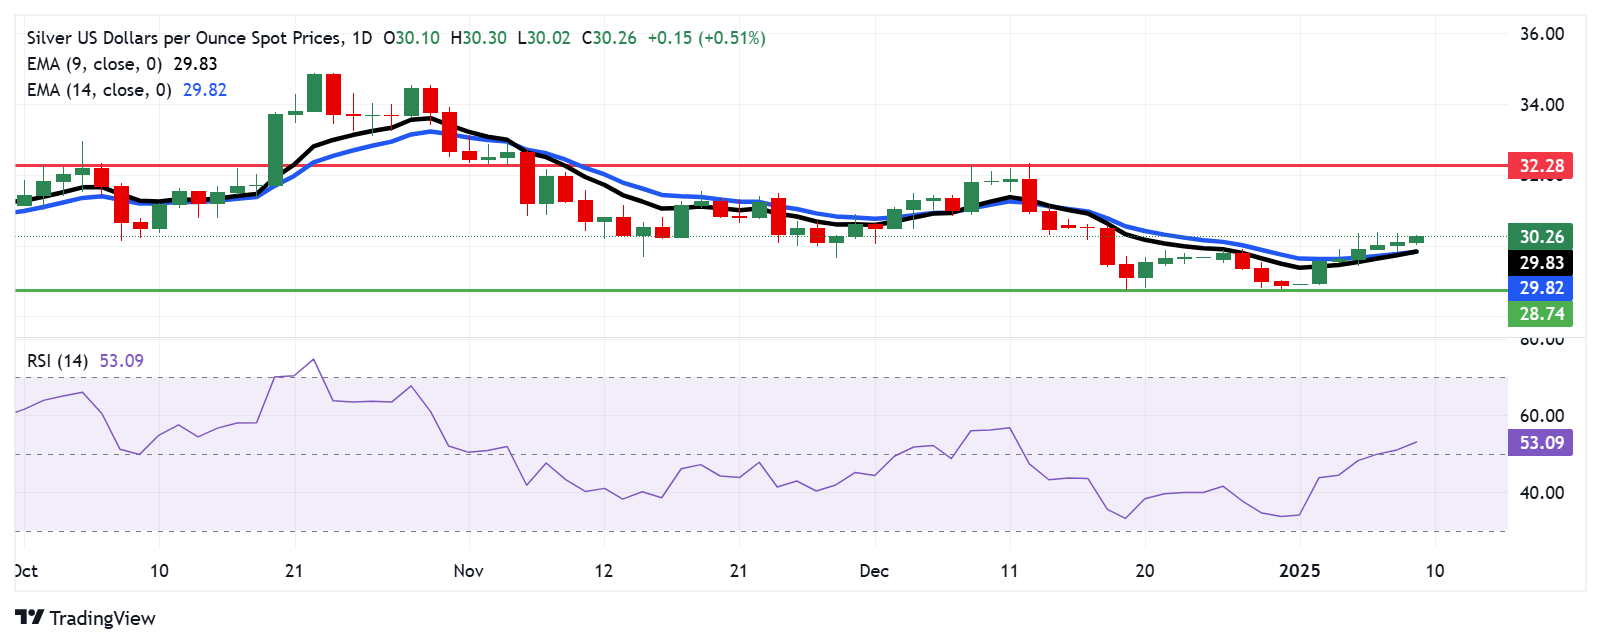
- Silver price moves higher along nine- and 14-day EMAs, establishing a bullish bias.
- The primary resistance appears at the psychological level of $31.00.
- The pair may test initial support at the psychological level of $30.00, followed by the nine-day EMA at $29.83.
Silver prices (XAG/USD) continue their upward trend, extending the winning streak that began on January 1. The grey metal trades around $30.20 per troy ounce during the European hours on Thursday. A closer look at the daily chart suggests a developing bullish bias, with the XAG/USD pair pushing higher along nine- and 14-day Exponential Moving Averages (EMAs), signaling robust short-term price momentum.
The 14-day Relative Strength Index (RSI) has also climbed above the 50 level, reinforcing the bullish sentiment. A further increase in Silver price could indicate growing bullish momentum. However, the alignment of the nine-day EMA with the 14-day EMA still suggests the absence of a strong directional trend in the short-term price movement.
Silver price may face potential resistance at the psychological level of $31.00. A decisive break above this level could bolster bullish momentum, paving the way for the metal to target the two-month high of $32.28, last reached on December 9.
On the downside, immediate support is likely at the psychological level of $30.00, followed by the nine-day EMA at $29.83. A break below this level could weaken short-term momentum, potentially pushing the XAG/USD pair toward the four-month low of $29.82, recorded on December 19.
XAG/USD: Daily Chart
Silver FAQs
Silver is a precious metal highly traded among investors. It has been historically used as a store of value and a medium of exchange. Although less popular than Gold, traders may turn to Silver to diversify their investment portfolio, for its intrinsic value or as a potential hedge during high-inflation periods. Investors can buy physical Silver, in coins or in bars, or trade it through vehicles such as Exchange Traded Funds, which track its price on international markets.
Silver prices can move due to a wide range of factors. Geopolitical instability or fears of a deep recession can make Silver price escalate due to its safe-haven status, although to a lesser extent than Gold's. As a yieldless asset, Silver tends to rise with lower interest rates. Its moves also depend on how the US Dollar (USD) behaves as the asset is priced in dollars (XAG/USD). A strong Dollar tends to keep the price of Silver at bay, whereas a weaker Dollar is likely to propel prices up. Other factors such as investment demand, mining supply – Silver is much more abundant than Gold – and recycling rates can also affect prices.
Silver is widely used in industry, particularly in sectors such as electronics or solar energy, as it has one of the highest electric conductivity of all metals – more than Copper and Gold. A surge in demand can increase prices, while a decline tends to lower them. Dynamics in the US, Chinese and Indian economies can also contribute to price swings: for the US and particularly China, their big industrial sectors use Silver in various processes; in India, consumers’ demand for the precious metal for jewellery also plays a key role in setting prices.
Silver prices tend to follow Gold's moves. When Gold prices rise, Silver typically follows suit, as their status as safe-haven assets is similar. The Gold/Silver ratio, which shows the number of ounces of Silver needed to equal the value of one ounce of Gold, may help to determine the relative valuation between both metals. Some investors may consider a high ratio as an indicator that Silver is undervalued, or Gold is overvalued. On the contrary, a low ratio might suggest that Gold is undervalued relative to Silver.
Recommended Articles


