

Silver Price Forecast: XAG/USD stays in tight range near $32 with US NFP under spotlight
- Silver price remains firm near $32 in countdown to US NFP.
- The US labor market data will influence the Fed’s likely policy-easing pace.
- Middle East conflict has strengthened Silver’s appeal as a safe haven.
Silver price (XAG/USD) oscillates in a tight range near the crucial resistance of $32.00 in Friday’s European session. The white metal stays firm due to widening conflicts in the Middle East region between Israel and Iran-backed Hezbollah. Historically, the safe-haven appeal of precious metals improves amid geopolitical uncertainty.
In today’s session, the major trigger for the Silver price will be the United States (US) Nonfarm Payrolls (NFP) data for September, which will be published at 12:30 GMT. The official employment data will significantly influence market expectations for the Federal Reserve’s (Fed) interest rate outlook.
On September 18, the Fed pivoted to policy normalization with a larger-than-usual interest rate cut of 50 basis points (bps). After the Fed’s decision of jumbo rate cut, comments from Fed Chair Jerome Powell and his teammates have indicated that the central bank was more focused on reviving job growth amid confidence that price pressures are on track to return to the bank’s target of 2%.
The US NFP report is expected to show that 140K fresh payrolls were added, similar to 142K in August. The Unemployment Rate is seen steady at 4.2%. Investors will also focus on Average Hourly Earnings data, a key measure to wage growth, which is expected to have grown by 3.8% steadily year-on-year.
Meanwhile, the US Dollar Index (DXY), which tracks the Greenback’s value against six major currencies, edges lower but trades close to its two-week high around 102.00.
Silver technical analysis
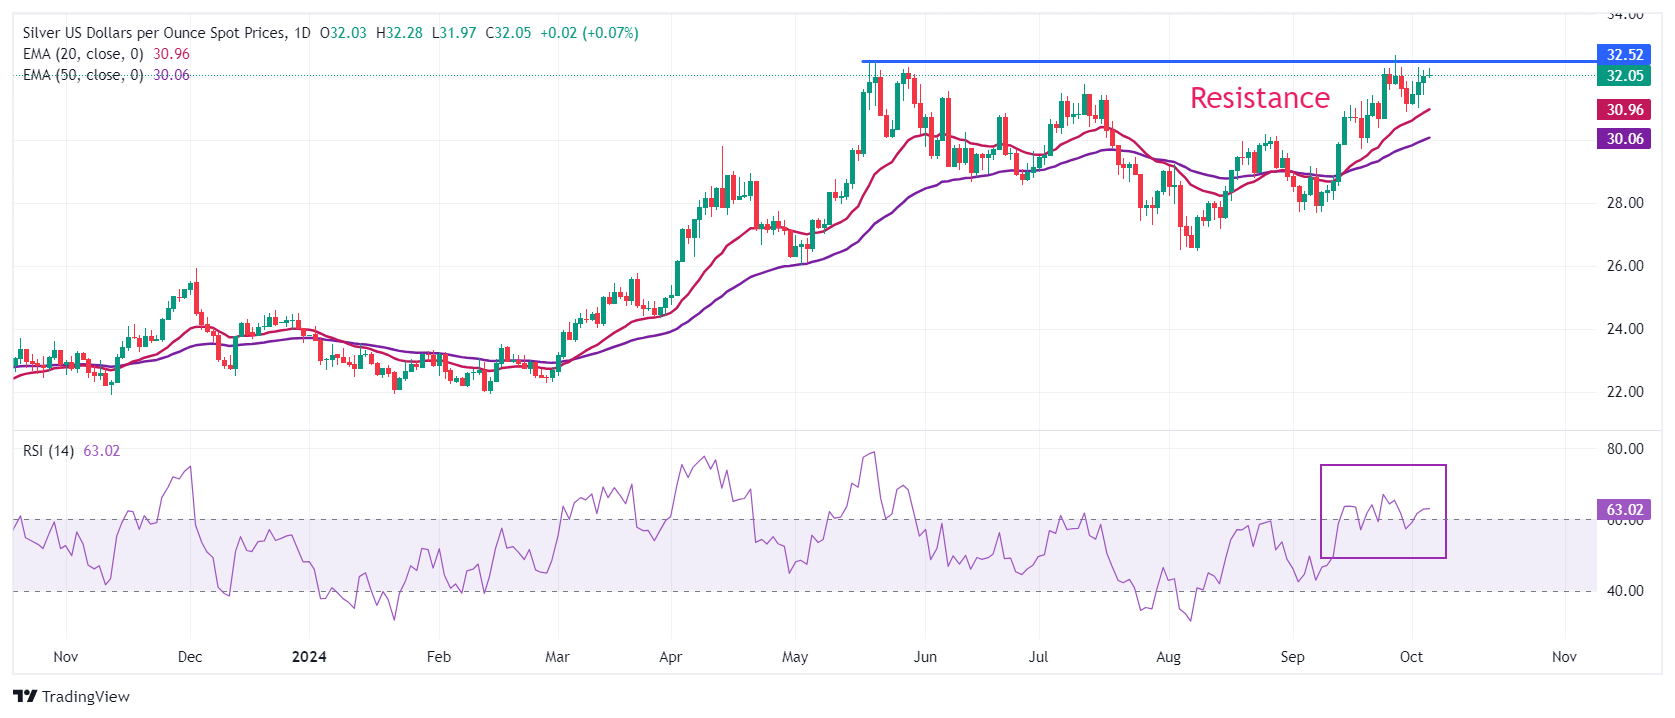
Silver price trades close to near the horizontal resistance plotted from May 20 high of $32.50 on a daily timeframe. The white metal strives for more upside as the outlook is upbeat due to upward-sloping 20 and 50-day Exponential Moving Averages (EMAs), which trade around $31.00 and $30.00, respectively.
The 14-day Relative Strength Index (RSI) remains in the bullish range of 60.00-80.00, suggesting more upside ahead.
Silver daily chart
Silver FAQs
Silver is a precious metal highly traded among investors. It has been historically used as a store of value and a medium of exchange. Although less popular than Gold, traders may turn to Silver to diversify their investment portfolio, for its intrinsic value or as a potential hedge during high-inflation periods. Investors can buy physical Silver, in coins or in bars, or trade it through vehicles such as Exchange Traded Funds, which track its price on international markets.
Silver prices can move due to a wide range of factors. Geopolitical instability or fears of a deep recession can make Silver price escalate due to its safe-haven status, although to a lesser extent than Gold's. As a yieldless asset, Silver tends to rise with lower interest rates. Its moves also depend on how the US Dollar (USD) behaves as the asset is priced in dollars (XAG/USD). A strong Dollar tends to keep the price of Silver at bay, whereas a weaker Dollar is likely to propel prices up. Other factors such as investment demand, mining supply – Silver is much more abundant than Gold – and recycling rates can also affect prices.
Silver is widely used in industry, particularly in sectors such as electronics or solar energy, as it has one of the highest electric conductivity of all metals – more than Copper and Gold. A surge in demand can increase prices, while a decline tends to lower them. Dynamics in the US, Chinese and Indian economies can also contribute to price swings: for the US and particularly China, their big industrial sectors use Silver in various processes; in India, consumers’ demand for the precious metal for jewellery also plays a key role in setting prices.
Silver prices tend to follow Gold's moves. When Gold prices rise, Silver typically follows suit, as their status as safe-haven assets is similar. The Gold/Silver ratio, which shows the number of ounces of Silver needed to equal the value of one ounce of Gold, may help to determine the relative valuation between both metals. Some investors may consider a high ratio as an indicator that Silver is undervalued, or Gold is overvalued. On the contrary, a low ratio might suggest that Gold is undervalued relative to Silver.
Recommended Articles


