

Crude Oil bears over 8% loss for September
- Crude Oil resides near the annual low after being unable to significantly bounce higher on Monday.
- Markets struggle to digest the OPEC report, which might be too optimistic about the demand for 2025.
- The US Dollar Index trades below 101.50 after Kamala Harris was called for victory in the overnight presidential debate.
Crude Oil’s price jumps near 1.5% and recovers above $66.80 on Wednesday. The positive trading day is very welcome for the much-battered commodity, which at one point faced nearly 10% losses for September and reached its lowest level since May 4, 2023, on Tuesday. The decline to $64.75 unfolded after the latest monthly Organization of the Petroleum Exporting Countries (OPEC) report showed on Tuesday that the OPEC was very positive on its demand forecast and mentioned that only a few ten thousand barrels per day reduction would be enough to limit oversupply and meet forecasted demand.
The US Dollar Index (DXY), which tracks the performance of the US Dollar (USD) against a basket of currencies, is easing since Vice President Kamala Harris was labelled victor in the overnight presidential debate against former US President Donald Trump. However, the focus is shifting to the US Consumer Price Index (CPI) release for August. The number bears a big importance, with markets still unsure whether to lock in a 25- or 50-basis point interest rate cut from the US Federal Reserve (Fed) next week.
At the time of writing, Crude Oil (WTI) trades at $66.78 and Brent Crude at $70.47
Oil news and market movers: OPEC report deemed too optimistic
- The Energy Information Administration (EIA) also released its monthly Oil outlook and saw US demand plateauing while markets will remain in deficit due to the OPEC output cuts, according to Bloomberg reports.
- The American Petroleum Institute (API) reported a drawdown by 2.79 million barrels in its recent stockpile change of Crude Oil number on Tuesday. There was a small build of 0.7 million expected.
- At 14:30 GMT, the EIA will publish its weekly Crude Stockpile Change for the week ending September 6. A build of 0.9 million is expected following the previous draw of 6.873 million barrels.
Oil Technical Analysis: Here comes the dead-cat
Crude Oil has cracked under pressure after markets saw the small cuts in forecasted demand from OPEC not really being in lie with reality. Recent data reveals an economic slowdown globally, with easing demand from the biggest market takers: China and the US. With this dislocation between OPEC’s projections and the economic reality, any upside moves are expected to remain short-lived as long as current supply and demand imbalances remain at hand.
There is a long road to recovery before heading back above $70. First up is $66.91, which acts as resistance now after it lost its place as a support. Once that level gets reclaimed, $70.00 gets back on the table with $71.20 as the first level to look out for. Ultimately, a return to $75.27 is still possible, but would come with a seismic shift or disruption in current balances.
The next level further down the line is $64.38, the low from March and May 2023. Should that level face a second test and snap, $61.65 becomes a target, with of course $60.00 as a psychologically big figure just below it, at least tempting to be tested.
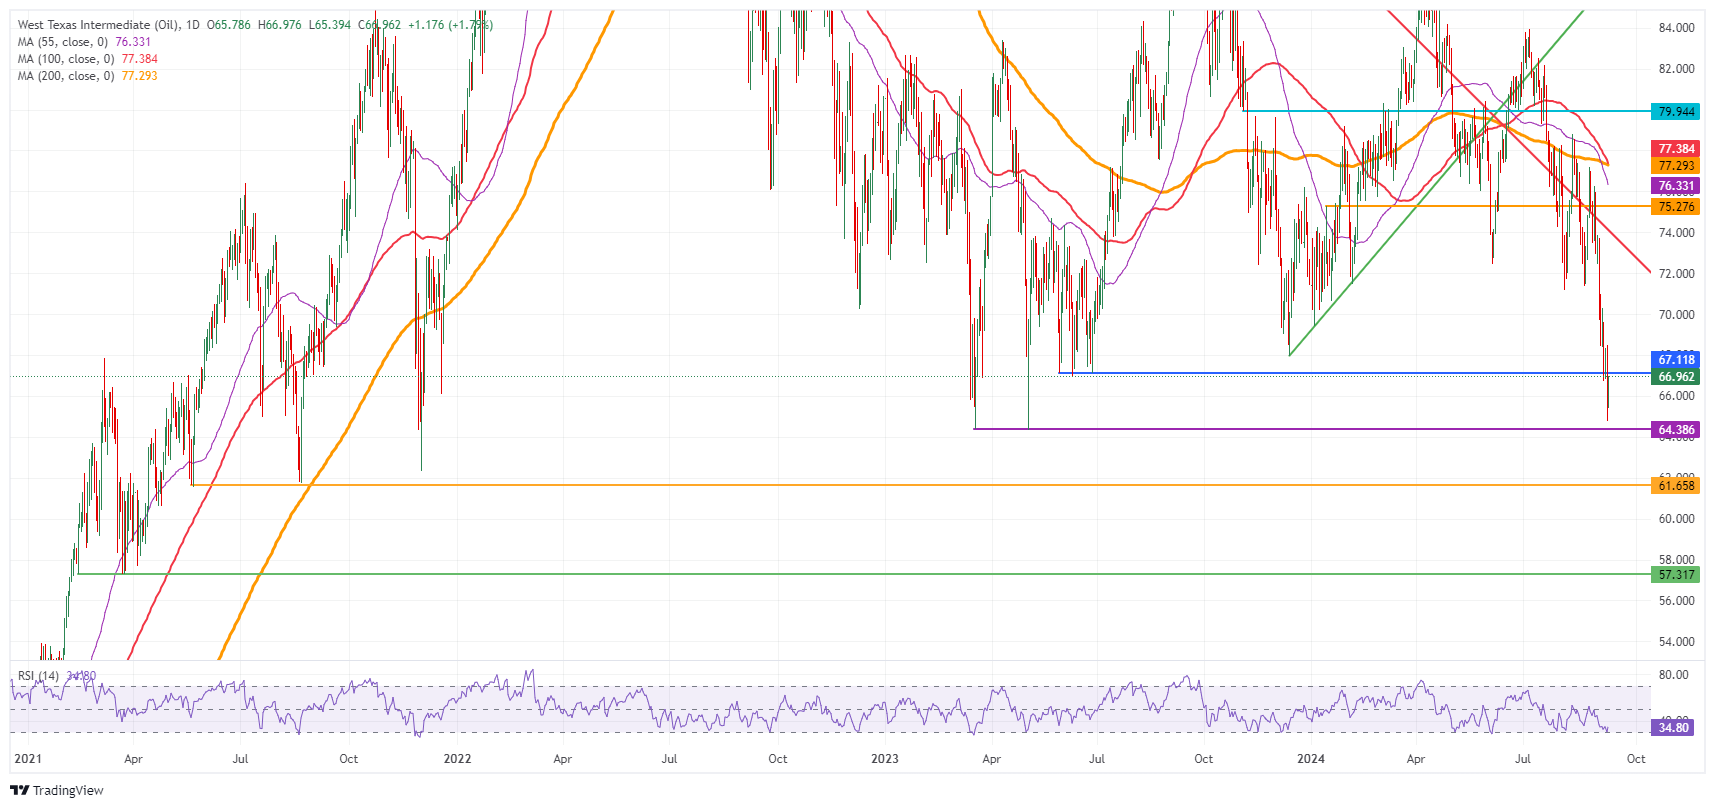
US WTI Crude Oil: Daily Chart
Brent Crude Oil FAQs
Brent Crude Oil is a type of Crude Oil found in the North Sea that is used as a benchmark for international Oil prices. It is considered ‘light’ and ‘sweet’ because of its high gravity and low sulfur content, making it easier to refine into gasoline and other high-value products. Brent Crude Oil serves as a reference price for approximately two-thirds of the world's internationally traded Oil supplies. Its popularity rests on its availability and stability: the North Sea region has well-established infrastructure for Oil production and transportation, ensuring a reliable and consistent supply.
Like all assets supply and demand are the key drivers of Brent Crude Oil price. As such, global growth can be a driver of increased demand and vice versa for weak global growth. Political instability, wars, and sanctions can disrupt supply and impact prices. The decisions of OPEC, a group of major Oil-producing countries, is another key driver of price. The value of the US Dollar influences the price of Brent Crude Oil, since Oil is predominantly traded in US Dollars, thus a weaker US Dollar can make Oil more affordable and vice versa.
The weekly Oil inventory reports published by the American Petroleum Institute (API) and the Energy Information Agency (EIA) impact the price of Brent Crude Oil. Changes in inventories reflect fluctuating supply and demand. If the data shows a drop in inventories it can indicate increased demand, pushing up Oil price. Higher inventories can reflect increased supply, pushing down prices. API’s report is published every Tuesday and EIA’s the day after. Their results are usually similar, falling within 1% of each other 75% of the time. The EIA data is considered more reliable, since it is a government agency.
OPEC (Organization of the Petroleum Exporting Countries) is a group of 13 Oil producing nations who collectively decide production quotas for member countries at twice-yearly meetings. Their decisions often impact Brent Crude Oil prices. When OPEC decides to lower quotas, it can tighten supply, pushing up Oil prices. When OPEC increases production, it has the opposite effect. OPEC+ refers to an expanded group that includes ten extra non-OPEC members, the most notable of which is Russia.
Recommended Articles


