

Silver Price Forecast: XAG/USD declines to $30.70 amid uncertainty ahead of China’s third plenum
- Silver price tumbles to near $30.70 as investors turn cautious ahead of China’s third plenum.
- Firm speculation for Fed rate cuts in September keeps the Silver price outlook firm.
- Investors await the US PPI data for more guidance on interest rates.
Silver price (XAG/USD) plummets to near $30.70 from a six-week high of $31.80 in Friday’s European session. The white metal weakens as investors turn cautious ahead of China’s third plenum meeting, which is scheduled for next week.
Top members of the ruling Communist Party are expected to announce policies favoring a boost to real estate and activities in the manufacturing sector and measures to prompt consumer spending. A larger-than-expected boost for fiscal spending in the world’s second-largest nation would propel Silver’s demand outlook. The industrial demand of the white metal has increased significantly in sectors like automobiles and green hydrogen etc.
Meanwhile, the broader outlook of the Silver price remains firm as the recent United States (US) Consumer Price Index (CPI) report for June has confirmed that price pressures are on course to return to the desired rate of 2%. Signs of resumption in the disinflation process have prompted expectations of early rate cuts by the Federal Reserve (Fed) Traders have raised bets significantly in favor of the Fed to begin reducing interest rates from the September meeting.
Rising expectations for Fed rate cuts have weighed heavily on the US Dollar (USD) and bond yields. The US Dollar Index (DXY), which tracks the Greenback’s value against six major currencies, falls to 104.35. 10-year US Treasury yields rebound to near 4.22% but have fallen vertically from 4.30%.
In Friday’s session, investors will focus on the US Producer Price Index (PPI) data for June, which will be published at 12:30 GMT.
Silver technical analysis
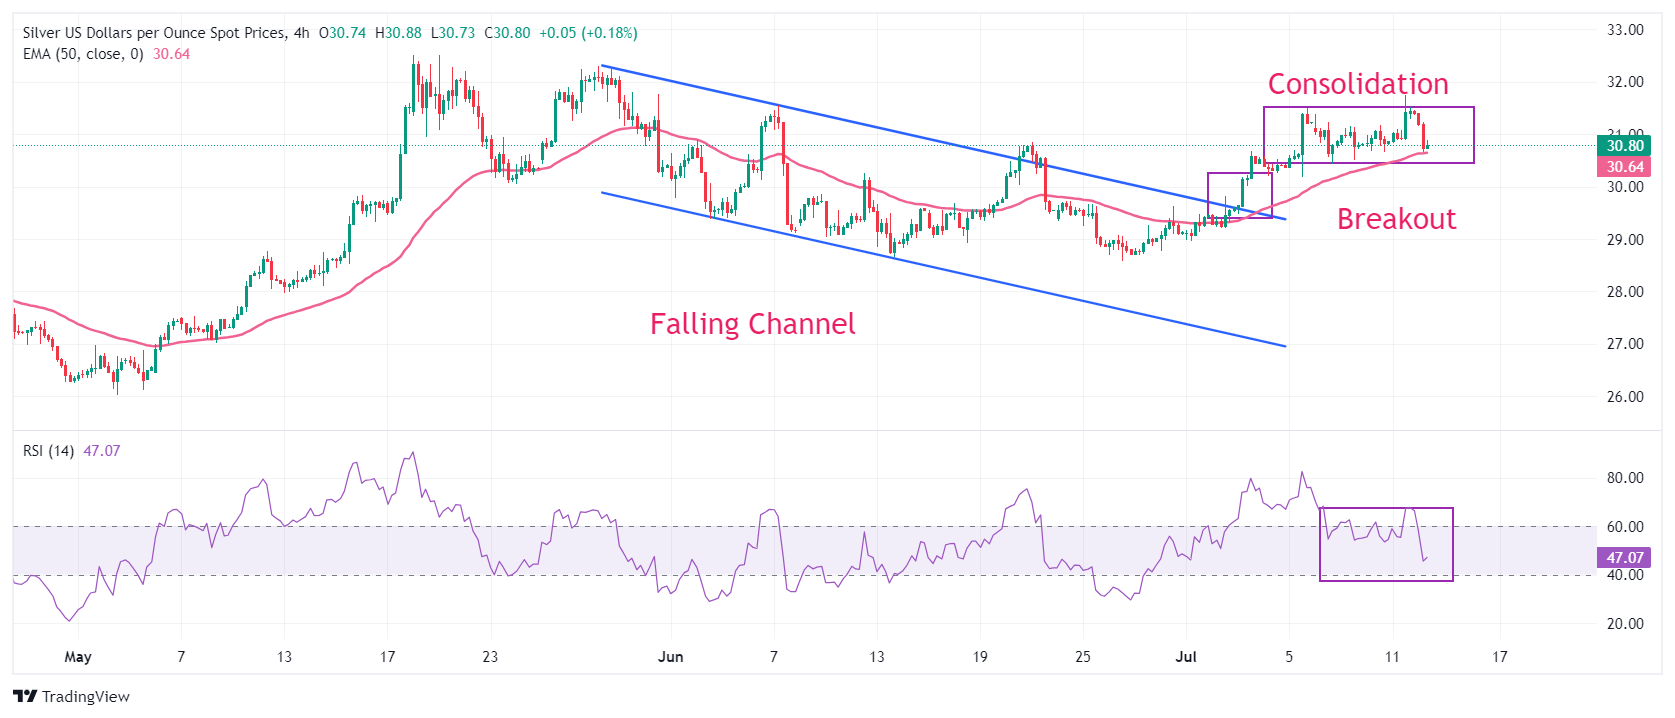
Silver price trades sideways in a narrow range around $31.00, suggesting a sharp volatility contraction. The overall trend remains bullish as it has turned sideways after a decisive breakout of the Bullish Flag chart formation on a four-hour timeframe.
The 50-period Exponential Moving Average (EMA) near $30.65 continues to provide support to the Silver price bulls.
The 14-period Relative Strength Index (RSI) fails to break above 60.00. A decisive break above the same would push the momentum toward the upside.
Silver four-hour chart
Silver FAQs
Silver is a precious metal highly traded among investors. It has been historically used as a store of value and a medium of exchange. Although less popular than Gold, traders may turn to Silver to diversify their investment portfolio, for its intrinsic value or as a potential hedge during high-inflation periods. Investors can buy physical Silver, in coins or in bars, or trade it through vehicles such as Exchange Traded Funds, which track its price on international markets.
Silver prices can move due to a wide range of factors. Geopolitical instability or fears of a deep recession can make Silver price escalate due to its safe-haven status, although to a lesser extent than Gold's. As a yieldless asset, Silver tends to rise with lower interest rates. Its moves also depend on how the US Dollar (USD) behaves as the asset is priced in dollars (XAG/USD). A strong Dollar tends to keep the price of Silver at bay, whereas a weaker Dollar is likely to propel prices up. Other factors such as investment demand, mining supply – Silver is much more abundant than Gold – and recycling rates can also affect prices.
Silver is widely used in industry, particularly in sectors such as electronics or solar energy, as it has one of the highest electric conductivity of all metals – more than Copper and Gold. A surge in demand can increase prices, while a decline tends to lower them. Dynamics in the US, Chinese and Indian economies can also contribute to price swings: for the US and particularly China, their big industrial sectors use Silver in various processes; in India, consumers’ demand for the precious metal for jewellery also plays a key role in setting prices.
Silver prices tend to follow Gold's moves. When Gold prices rise, Silver typically follows suit, as their status as safe-haven assets is similar. The Gold/Silver ratio, which shows the number of ounces of Silver needed to equal the value of one ounce of Gold, may help to determine the relative valuation between both metals. Some investors may consider a high ratio as an indicator that Silver is undervalued, or Gold is overvalued. On the contrary, a low ratio might suggest that Gold is undervalued relative to Silver.
Recommended Articles


