

WTI Price Forecast: Eyes further upside towards $100 amid Hormuz closure
- The Oil price reflects strength as the Strait of Hormuz remains closed.
- Washington states that Iran’s proposal to end the war is not good enough.
- Citi expects Brent Crude Oil to extend the rally to $150 if Hormuz remains closed through the end of June.
West Texas Intermediate (WTI), futures on NYMEX, trades over 1% above $96.00 during the European trading session on Tuesday. The Oil price demonstrates broader strength as the global energy crisis remains intact in the wake of the long closure of the Strait of Hormuz, a vital passage to almost 20% of global energy supply.
The uncertainty over the Hormuz closure remains high amid stalled peace talks between the United States (US) and Iran. Washington is showing the least interest in resuming negotiations with Iran, citing that their proposal “is not good enough”. Meanwhile, Iran wants the US to lift its blockade on Iranian ships as a precondition for negotiations on Tehran’s nuclear ambitions.
Market experts have warned that oil prices could rise further as long as the Strait of Hormuz remains closed. Under a bull-case scenario, Citibank assumes oil flows through the strait remain disrupted through the end of June and sees Brent prices spiking to $150 a barrel. As of writing, Brent Crude Oil trades 1.1% higher to near $103.
Meanwhile, investors await monetary policy announcements from key global central banks, including the Federal Reserve (Fed), the European Central Bank (ECB), and the Bank of England (BoE), to get fresh cues on the global oil demand outlook.
WTI technical analysis
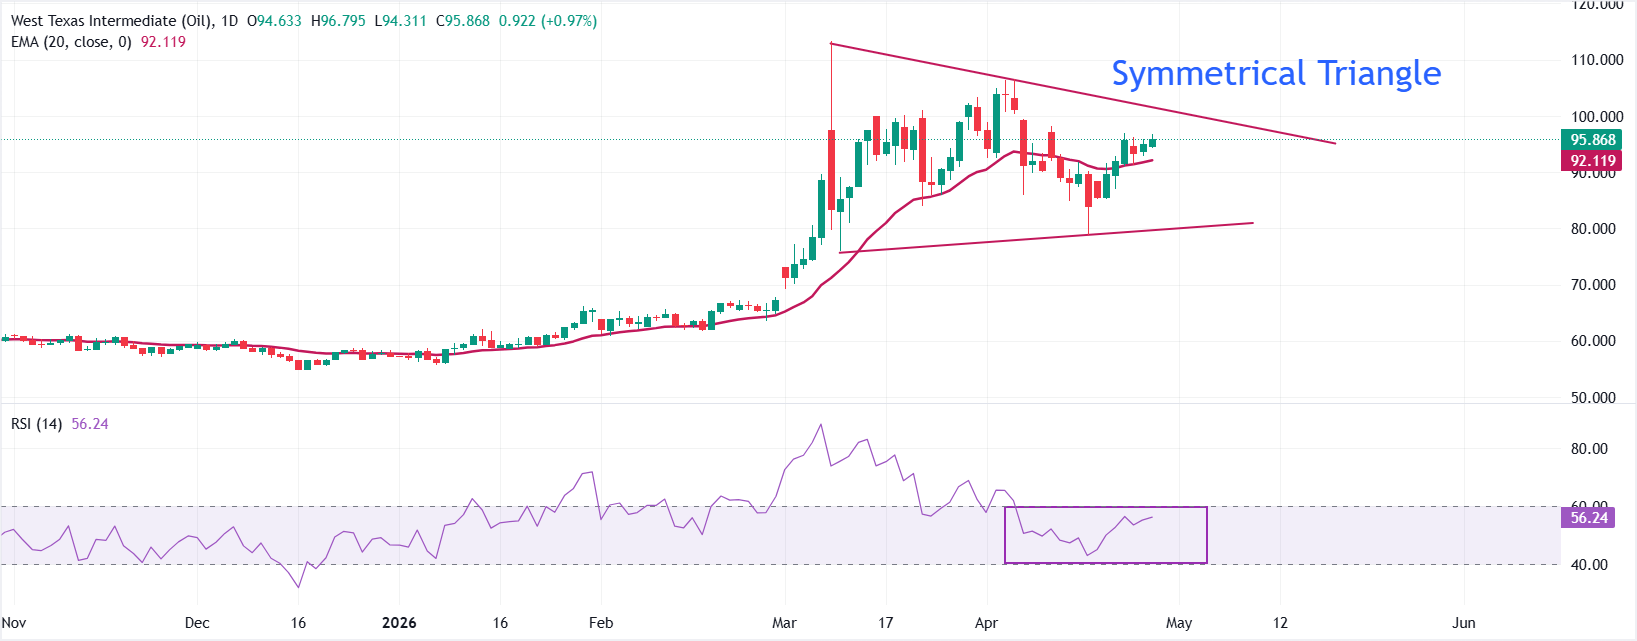
WTI US Oil trades higher at around $96 as of writing. The near-term tone stays constructive as price holds above the 20-day exponential moving average (EMA) at roughly $92.12.
Momentum, reflected by the Relative Strength Index (14) hovering in the mid-50s, suggests mild bullish pressure rather than overbought conditions, leaving scope for further gains while the contract remains supported above its short-term EMA.
On the topside, initial resistance is seen at the prior downward-trending border of the Symmetrical Triangle around $100.37, where a clear close higher would open the door to a more decisive bullish extension. On the downside, immediate support emerges at the 20-day EMA near $92.12, with the rising structural floor from the upward-sloping border of the above-mentioned chart pattern sitting much lower around $80.01; a drop through this latter area would significantly undermine the current bullish bias.
(The technical analysis of this story was written with the help of an AI tool.)
WTI Oil FAQs
WTI Oil is a type of Crude Oil sold on international markets. The WTI stands for West Texas Intermediate, one of three major types including Brent and Dubai Crude. WTI is also referred to as “light” and “sweet” because of its relatively low gravity and sulfur content respectively. It is considered a high quality Oil that is easily refined. It is sourced in the United States and distributed via the Cushing hub, which is considered “The Pipeline Crossroads of the World”. It is a benchmark for the Oil market and WTI price is frequently quoted in the media.
Like all assets, supply and demand are the key drivers of WTI Oil price. As such, global growth can be a driver of increased demand and vice versa for weak global growth. Political instability, wars, and sanctions can disrupt supply and impact prices. The decisions of OPEC, a group of major Oil-producing countries, is another key driver of price. The value of the US Dollar influences the price of WTI Crude Oil, since Oil is predominantly traded in US Dollars, thus a weaker US Dollar can make Oil more affordable and vice versa.
The weekly Oil inventory reports published by the American Petroleum Institute (API) and the Energy Information Agency (EIA) impact the price of WTI Oil. Changes in inventories reflect fluctuating supply and demand. If the data shows a drop in inventories it can indicate increased demand, pushing up Oil price. Higher inventories can reflect increased supply, pushing down prices. API’s report is published every Tuesday and EIA’s the day after. Their results are usually similar, falling within 1% of each other 75% of the time. The EIA data is considered more reliable, since it is a government agency.
OPEC (Organization of the Petroleum Exporting Countries) is a group of 12 Oil-producing nations who collectively decide production quotas for member countries at twice-yearly meetings. Their decisions often impact WTI Oil prices. When OPEC decides to lower quotas, it can tighten supply, pushing up Oil prices. When OPEC increases production, it has the opposite effect. OPEC+ refers to an expanded group that includes ten extra non-OPEC members, the most notable of which is Russia.
Recommended Articles


