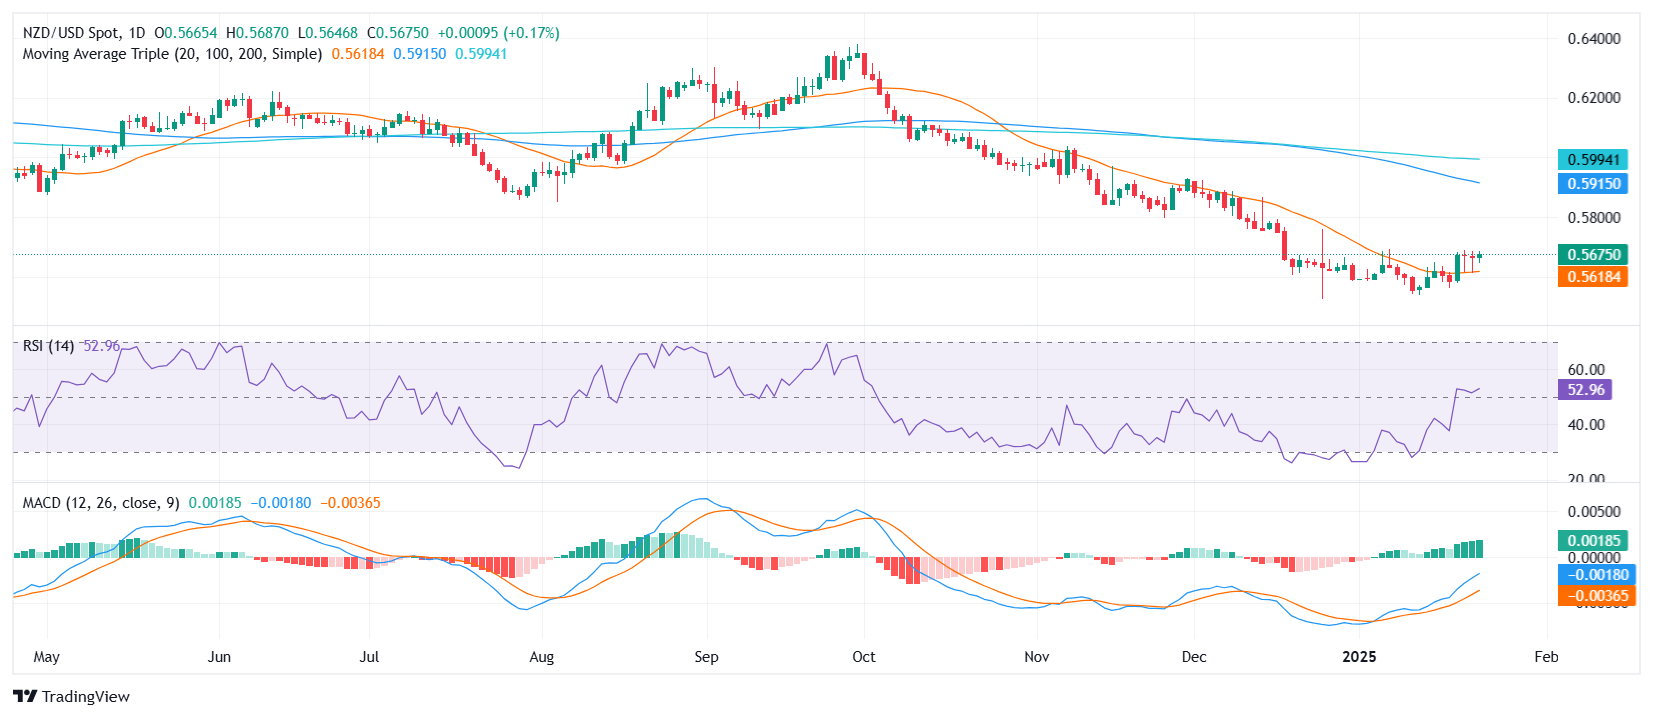
NZD/USD Price Analysis: Pair stabilizes near recent highs, bulls present

Source Fxstreet
  • NZD/USD tallies another winning day on Thursday.
  • The RSI climbs signaling strengthening bullish sentiment.
  • Pair seems to be building support around the 20-day SMA.

The NZD/USD pair settled at 0.5670, and the price action suggest a period of consolidation near recent highs but bullish momentum remains intact

Technical indicators reinforce the constructive outlook. The Relative Strength Index (RSI) has surged to 52, remaining in positive territory and reflecting increased buying interest. Additionally, the Moving Average Convergence Divergence (MACD) histogram continues to display rising green bars, underscoring sustained upward momentum and hinting at potential further gains in the near term.

From a technical perspective, immediate resistance lies at 0.5685, with a break above this level likely paving the way for a test of 0.5710. On the downside, support is observed at 0.5645, and any sustained drop below this level could trigger a deeper pullback toward 0.5610. Traders will be closely monitoring these levels as the pair seeks to establish a clearer directional bias.

NZD/USD daily chart

Disclaimer: For information purposes only. Past performance is not indicative of future results.
placeholder
Bitcoin Drops Below $70,000 as Crypto Rally Fails to MaterializeThe crypto market experienced a significant pullback, Bitcoin (BTCUSD) fell below the key $70,000 mark during intraday trading, triggering short-term stop-loss orders and causing market s
Author  TradingKey
5 hours ago
The crypto market experienced a significant pullback, Bitcoin (BTCUSD) fell below the key $70,000 mark during intraday trading, triggering short-term stop-loss orders and causing market s
placeholder
Gold falls below $4,850 as Fed holds rates steadyGold price (XAU/USD) faces some selling pressure near $4,830 during the early Asian session on Thursday.
Author  FXStreet
14 hours ago
Gold price (XAU/USD) faces some selling pressure near $4,830 during the early Asian session on Thursday.
placeholder
WTI Crude Prices Capped at $100, Has the Rally Ended? How to Trade the Short Term? Today (March 18), WTI crude oil continued to exhibit significant short-term volatility, driven by a tug-of-war between headlines and data. Intraday, prices retreated from Tuesday's high o
Author  TradingKey
Yesterday 10: 33
Today (March 18), WTI crude oil continued to exhibit significant short-term volatility, driven by a tug-of-war between headlines and data. Intraday, prices retreated from Tuesday's high o
placeholder
Silver Price Forecast: XAG/USD consolidates above $79.00; bearish bias intact ahead of FedSilver (XAG/USD) lacks a firm intraday direction and oscillates in a narrow range during the Asian session on Wednesday as traders opt to wait on the sidelines ahead of the crucial FOMC rate decision.
Author  FXStreet
Yesterday 02: 16
Silver (XAG/USD) lacks a firm intraday direction and oscillates in a narrow range during the Asian session on Wednesday as traders opt to wait on the sidelines ahead of the crucial FOMC rate decision.
placeholder
WTI rises above $95.00 as Iran's attacks on facilities fuel supply fearsWest Texas Intermediate (WTI), the US crude oil benchmark, is trading around $95.00 during the early Asian trading hours on Wednesday. The WTI price climbs amid intensifying Middle East conflict and severe supply disruptions.
Author  FXStreet
Yesterday 01: 29
West Texas Intermediate (WTI), the US crude oil benchmark, is trading around $95.00 during the early Asian trading hours on Wednesday. The WTI price climbs amid intensifying Middle East conflict and severe supply disruptions.
Related Instrument
goTop
quote