

EUR/CAD Price Forecast: Depreciates to near 1.4800, tests oversold levels
- EUR/CAD may find immediate support at the psychological level of 1.4800.
- The 14-day RSI signals sustained bearish momentum as it remains slightly above the 30 level.
- The pair may explore the area around a “pullback resistance” at the 1.4870 level.
The EUR/CAD cross struggles to rebound from three consecutive days of losses, trading around the 1.4810 mark during the Asian hours on Wednesday. A technical analysis of a daily chart indicates a strong bearish momentum, with indicators suggesting that sellers are still firmly in control of the market. However, oversold conditions may be approaching, hinting at the possibility of a short-term correction.
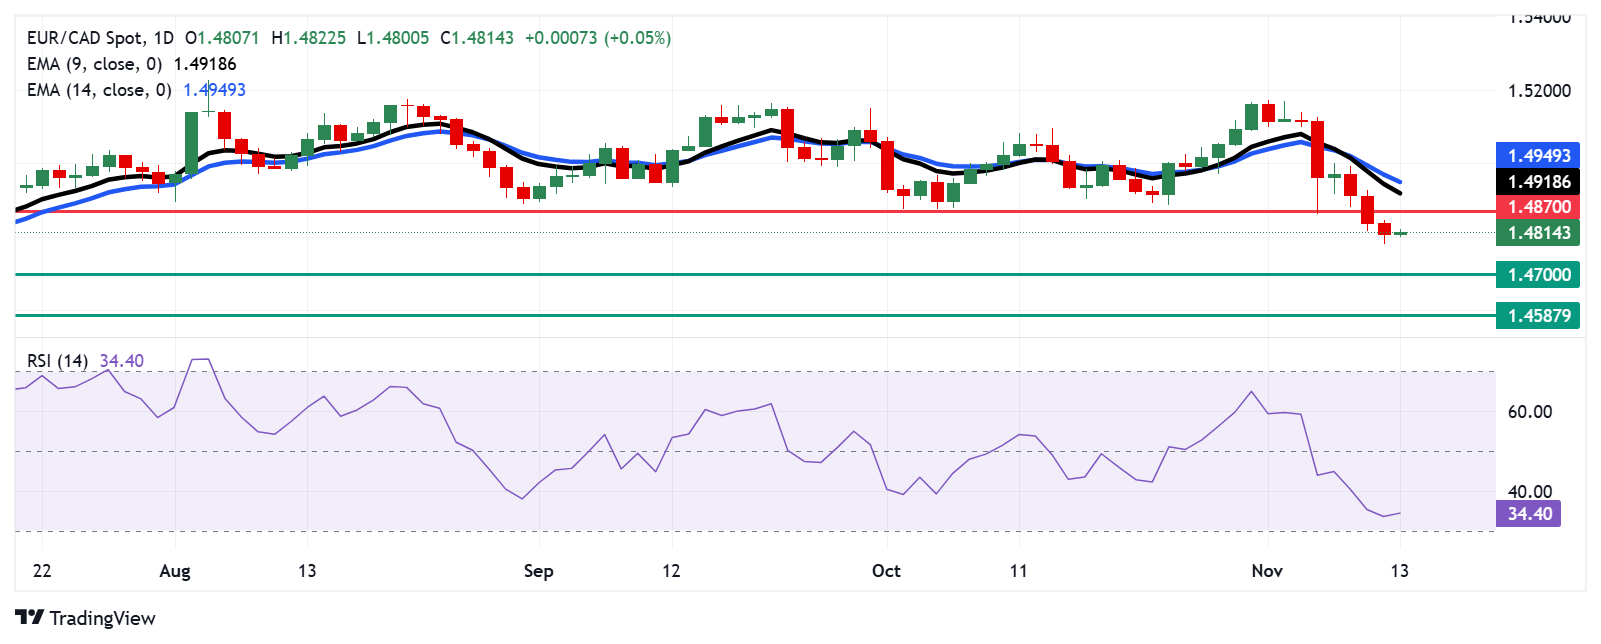
On the daily chart, EUR/CAD is trading below the nine-day Exponential Moving Average (EMA), which has been serving as a dynamic resistance line over recent sessions. The nine-day EMA has also diverged below the 14-day EMA, creating a "bearish crossover" that reflects weakening short-term momentum and solidifying the pair’s downward trajectory.
The 14-day RSI, a popular tool for identifying overbought or oversold conditions, currently sits slightly above the 30 level. This placement signals sustained bearish momentum without fully confirming an oversold condition. Should the RSI drop below the critical 30 mark, traders may look for signs of an upward correction. A bounce from oversold conditions could bring the pair back toward the 1.4850-1.4900 range, where sellers may once again test the resilience of any recovery attempt.
On the downside, the 1.4800 mark is acting as a psychological level and could be the first line of defense if selling pressure continues. This level is often pivotal, as psychological levels can attract buying interest from traders hoping for a potential rebound.
If the EUR/CAD cross breaks below 1.4800, the next critical support lies at 1.4700. This level holds significant importance for technical traders, as it could either slow the decline or reinforce the bearish trend if broken decisively. A drop below this level could set the stage for EUR/CAD to approach its seven-month low at 1.4587.
On the upside, the EUR/CAD pair encounters its first hurdle around 1.4870, a level that previously served as support but has now turned into “pullback resistance.” A move above this “throwback” level could indicate that bullish sentiment is emerging, albeit cautiously, among market participants.
Should the EUR/CAD break above 1.4870, attention will shift to the nine-day EMA at 1.4918 and the 14-day EMA at 1.4949. Both levels represent dynamic resistance points and would need to be overcome for any meaningful bullish momentum to develop.
EUR/CAD: Daily Chart
Euro FAQs
The Euro is the currency for the 19 European Union countries that belong to the Eurozone. It is the second most heavily traded currency in the world behind the US Dollar. In 2022, it accounted for 31% of all foreign exchange transactions, with an average daily turnover of over $2.2 trillion a day. EUR/USD is the most heavily traded currency pair in the world, accounting for an estimated 30% off all transactions, followed by EUR/JPY (4%), EUR/GBP (3%) and EUR/AUD (2%).
The European Central Bank (ECB) in Frankfurt, Germany, is the reserve bank for the Eurozone. The ECB sets interest rates and manages monetary policy. The ECB’s primary mandate is to maintain price stability, which means either controlling inflation or stimulating growth. Its primary tool is the raising or lowering of interest rates. Relatively high interest rates – or the expectation of higher rates – will usually benefit the Euro and vice versa. The ECB Governing Council makes monetary policy decisions at meetings held eight times a year. Decisions are made by heads of the Eurozone national banks and six permanent members, including the President of the ECB, Christine Lagarde.
Eurozone inflation data, measured by the Harmonized Index of Consumer Prices (HICP), is an important econometric for the Euro. If inflation rises more than expected, especially if above the ECB’s 2% target, it obliges the ECB to raise interest rates to bring it back under control. Relatively high interest rates compared to its counterparts will usually benefit the Euro, as it makes the region more attractive as a place for global investors to park their money.
Data releases gauge the health of the economy and can impact on the Euro. Indicators such as GDP, Manufacturing and Services PMIs, employment, and consumer sentiment surveys can all influence the direction of the single currency. A strong economy is good for the Euro. Not only does it attract more foreign investment but it may encourage the ECB to put up interest rates, which will directly strengthen the Euro. Otherwise, if economic data is weak, the Euro is likely to fall. Economic data for the four largest economies in the euro area (Germany, France, Italy and Spain) are especially significant, as they account for 75% of the Eurozone’s economy.
Another significant data release for the Euro is the Trade Balance. This indicator measures the difference between what a country earns from its exports and what it spends on imports over a given period. If a country produces highly sought after exports then its currency will gain in value purely from the extra demand created from foreign buyers seeking to purchase these goods. Therefore, a positive net Trade Balance strengthens a currency and vice versa for a negative balance.
Recommended Articles


