Australian Dollar edges higher, upside seems limited due to potential Trump’s tariff

Source Fxstreet
  • The Australian Dollar faced downward pressure from concerns over Trump’s tariffs on Chinese goods.
  • The AUD faced challenges as China's latest stimulus measures fell short of investors’ expectations.
  • Trump’s fiscal policies could heighten inflation risks, prompting the Fed to adopt a more restrictive policy stance.

The Australian Dollar (AUD) gains ground on Monday despite a generally negative outlook driven by concerns over Donald Trump’s proposed tariff increases on Chinese goods, which could impact Australian markets, one of China's largest trading partners. US markets will be closed for the Veteran’s Day Bank Holiday.

The AUD also faced potential downward pressure from lower-than-expected Chinese Consumer Price Index (CPI) data released on Saturday. Additionally, China's latest stimulus measures fell short of investor expectations, further dampening demand prospects for Australia’s largest trading partner and weighing on the Australian Dollar.

On Friday, China announced a 10 trillion Yuan debt package designed to alleviate local government financing pressures and support struggling economic growth. However, the package stopped short of implementing direct economic stimulus measures.

Australia's 10-year government bond yield dropped to around 4.6%, reflecting a decline in US bond yields following the Federal Reserve's widely anticipated 25 basis point interest rate cut. Last week, the Reserve Bank of Australia (RBA) kept its interest rate unchanged at 4.35%. The central bank emphasized that underlying inflation remains too high and is not expected to return to its target until 2026.

Daily Digest Market Movers: Australian Dollar faces challenges due to potential Trump’s tariff

  • Federal Reserve Bank of Minneapolis President Neel Kashkari stated on Sunday that the US economy has shown remarkable resilience as the Fed continues its efforts to curb inflation. However, Kashkari noted that the Fed is still “not all the way home.” He also mentioned that the Fed aims to be confident that inflation will fully return to the 2% target and needs additional evidence before considering another rate cut.
  • Morgan Stanley divides the Trump administration's macroeconomic policies into three key areas: tariffs, immigration, and fiscal measures. The report predicts that tariff policies will be prioritized, with an anticipated immediate imposition of 10% tariffs globally and 60% tariffs specifically on China.
  • Analysts suggest that if Trump’s fiscal policies are implemented, they could lead to higher investment, spending, and labor demand, elevating inflation risks. This could prompt the Fed to adopt a more restrictive monetary policy, potentially strengthening the US Dollar and putting additional pressure on the AUD/USD pair.
  • However, Fed Chair Jerome Powell stated on Thursday that he doesn’t anticipate Trump’s potential return to the White House impacting the Fed’s near-term policy decisions. “We don’t guess, speculate, and we don’t assume what future government policy choices will be,” Powell noted after the bank decided to lower interest rates by 25 basis points to a range of 4.50%-4.75%, as expected.
  • Fed Chair Jerome Powell also emphasized that the Fed will continue to assess economic data to decide on the "pace and destination" of future rate changes, highlighting that inflation has been gradually slowing toward the Fed's 2% target.
  • China’s Consumer Price Index (CPI) rose 0.3% year-over-year in October, slightly below market expectations and down from September’s 0.4%. This marks the ninth consecutive month of consumer price inflation but represents the lowest rate since June. Month-over-month, the CPI dropped by 0.3%, a sharper decline than the expected 0.1% decrease, following a flat reading in September.
  • On Friday, the preliminary University of Michigan Consumer Sentiment Index rose to 73.0 in November, up from 70.5 in October and exceeding the market’s expectation of 71.0.
  • US Initial Jobless Claims rose to 221,000 for the week ending November 1, according to a Thursday report from the US Department of Labor (DoL). This figure aligned with initial estimates and was up from the previous week’s revised total of 218,000 (originally reported as 216,000).

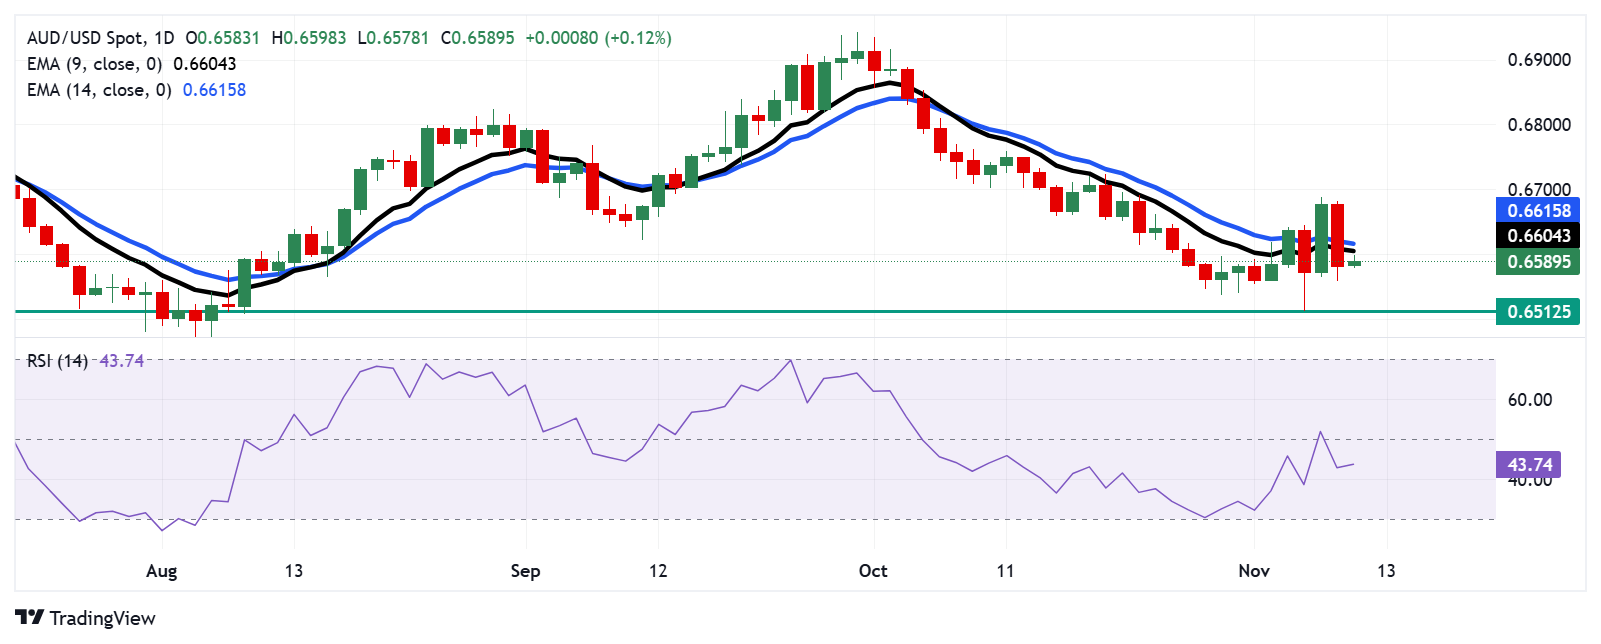
Technical Analysis: Australian Dollar trades below 0.6600, nine-day EMA

The AUD/USD pair trades around 0.6590 on Monday. Daily chart analysis indicated short-term downward pressure as the pair is positioned below the nine-day Exponential Moving Average (EMA). Additionally, the 14-day Relative Strength Index (RSI) has broken below the 50 mark, further suggesting that a bearish sentiment is prevailing.

In terms of support, the AUD/USD pair may approach its three-month low at 0.6512, which was recorded on November 6, followed by key psychological support at 0.6500.

On the upside, the immediate resistance appears at the nine-day EMA at 0.6604, followed by the 14-day EMA at 0.6616. A breakthrough above these EMAs could lead the AUD/USD pair to revisit its recent high at 0.6687 level, followed by the psychological level of 0.6700.

AUD/USD: Daily Chart

Australian Dollar PRICE Today

The table below shows the percentage change of Australian Dollar (AUD) against listed major currencies today. Australian Dollar was the strongest against the Japanese Yen.

  USD EUR GBP JPY CAD AUD NZD CHF
USD   -0.03% 0.02% 0.44% 0.13% -0.08% -0.12% 0.03%
EUR 0.03%   0.02% 0.58% 0.28% 0.04% -0.01% 0.14%
GBP -0.02% -0.02%   0.46% 0.26% 0.00% -0.04% 0.12%
JPY -0.44% -0.58% -0.46%   -0.31% -0.60% -0.47% -0.41%
CAD -0.13% -0.28% -0.26% 0.31%   -0.16% -0.26% -0.13%
AUD 0.08% -0.04% -0.01% 0.60% 0.16%   -0.06% 0.09%
NZD 0.12% 0.00% 0.04% 0.47% 0.26% 0.06%   0.13%
CHF -0.03% -0.14% -0.12% 0.41% 0.13% -0.09% -0.13%  

The heat map shows percentage changes of major currencies against each other. The base currency is picked from the left column, while the quote currency is picked from the top row. For example, if you pick the Australian Dollar from the left column and move along the horizontal line to the US Dollar, the percentage change displayed in the box will represent AUD (base)/USD (quote).

Australian Dollar FAQs

One of the most significant factors for the Australian Dollar (AUD) is the level of interest rates set by the Reserve Bank of Australia (RBA). Because Australia is a resource-rich country another key driver is the price of its biggest export, Iron Ore. The health of the Chinese economy, its largest trading partner, is a factor, as well as inflation in Australia, its growth rate and Trade Balance. Market sentiment – whether investors are taking on more risky assets (risk-on) or seeking safe-havens (risk-off) – is also a factor, with risk-on positive for AUD.

The Reserve Bank of Australia (RBA) influences the Australian Dollar (AUD) by setting the level of interest rates that Australian banks can lend to each other. This influences the level of interest rates in the economy as a whole. The main goal of the RBA is to maintain a stable inflation rate of 2-3% by adjusting interest rates up or down. Relatively high interest rates compared to other major central banks support the AUD, and the opposite for relatively low. The RBA can also use quantitative easing and tightening to influence credit conditions, with the former AUD-negative and the latter AUD-positive.

China is Australia’s largest trading partner so the health of the Chinese economy is a major influence on the value of the Australian Dollar (AUD). When the Chinese economy is doing well it purchases more raw materials, goods and services from Australia, lifting demand for the AUD, and pushing up its value. The opposite is the case when the Chinese economy is not growing as fast as expected. Positive or negative surprises in Chinese growth data, therefore, often have a direct impact on the Australian Dollar and its pairs.

Iron Ore is Australia’s largest export, accounting for $118 billion a year according to data from 2021, with China as its primary destination. The price of Iron Ore, therefore, can be a driver of the Australian Dollar. Generally, if the price of Iron Ore rises, AUD also goes up, as aggregate demand for the currency increases. The opposite is the case if the price of Iron Ore falls. Higher Iron Ore prices also tend to result in a greater likelihood of a positive Trade Balance for Australia, which is also positive of the AUD.

The Trade Balance, which is the difference between what a country earns from its exports versus what it pays for its imports, is another factor that can influence the value of the Australian Dollar. If Australia produces highly sought after exports, then its currency will gain in value purely from the surplus demand created from foreign buyers seeking to purchase its exports versus what it spends to purchase imports. Therefore, a positive net Trade Balance strengthens the AUD, with the opposite effect if the Trade Balance is negative.

Disclaimer: For information purposes only. Past performance is not indicative of future results.
placeholder
Gold Price Forecast: XAU/USD drifts higher above $4,200 as Fed delivers expected cutGold price (XAU/USD) gains momentum to around $4,235 during the early Asian session on Thursday. The precious metal extends its upside after the US Federal Reserve (Fed) delivered an expected third consecutive interest rate cut and maintained its outlook for just one cut in 2026.
Author  FXStreet
Dec 11, Thu
Gold price (XAU/USD) gains momentum to around $4,235 during the early Asian session on Thursday. The precious metal extends its upside after the US Federal Reserve (Fed) delivered an expected third consecutive interest rate cut and maintained its outlook for just one cut in 2026.
placeholder
Gold remains bid as lack of Fed clarity and geopolitical frictions persistGold (XAU/USD) advances modestly on Friday as traders seem to book profits ahead of the weekend, yet clings to gains of over 0.51% after reaching a seven-week high of $4,353. At the time of writing, XAU/USD trades at $4,302 as traders digest comments from Federal Reserve (Fed) officials.
Author  FXStreet
Yesterday 01: 34
Gold (XAU/USD) advances modestly on Friday as traders seem to book profits ahead of the weekend, yet clings to gains of over 0.51% after reaching a seven-week high of $4,353. At the time of writing, XAU/USD trades at $4,302 as traders digest comments from Federal Reserve (Fed) officials.
placeholder
Ethereum Price Slips Lower — $3,000 Looms as the Key BattlegroundEthereum is attempting to recover from a $3,026 low but remains below $3,200 and the 100-hour SMA, with a bearish trend line near $3,175 capping rebounds as bulls need a clean break above $3,200 to target $3,250–$3,400, while a drop below $3,050 risks a retest of $3,000 and $2,940.
Author  Mitrade
Yesterday 03: 25
Ethereum is attempting to recover from a $3,026 low but remains below $3,200 and the 100-hour SMA, with a bearish trend line near $3,175 capping rebounds as bulls need a clean break above $3,200 to target $3,250–$3,400, while a drop below $3,050 risks a retest of $3,000 and $2,940.
placeholder
Macro Analysts: Hawkish Japan Could Push Bitcoin Below $70KAnalysts predict Bitcoin may face further declines towards the $70,000 mark if the Bank of Japan raises interest rates as expected.
Author  Mitrade
Yesterday 05: 48
Analysts predict Bitcoin may face further declines towards the $70,000 mark if the Bank of Japan raises interest rates as expected.
placeholder
Bitcoin Slides 5% as Sellers Lean In — Can BTC Reclaim $88,000?Bitcoin has dropped back below $88,000 after rolling over from $90,500, with price still trading under the 100-hour Simple Moving Average. The sell-off found a floor at $85,151, and BTC is now consolidating near that base, but rebounds are facing pressure from a bearish trend line around $89,000. Bulls need to retake $88,000–$89,000 to ease downside risk; failure to do so keeps $85,500–$85,000 and then $83,500 in play, with $80,000 as the deeper “line in the sand.” Bitcoin (BTC) is back in damage-control mode after a sharp pullback wiped out recent gains. The price failed to reclaim the $90,000–$90,500 band, rolled over, and slid through $88,500 before briefly dipping under $87,000. Buyers did show up around $85,000, but the rebound so far looks more like stabilization than a clear trend reversal. Bitcoin dips hard, finds a bid near $85,000(h3) BTC’s latest move lower began when it couldn’t build follow-through above $90,000 and $90,500. Once that upside stalled, sellers took control and pushed price down through $88,500. The slide accelerated enough to spike below $87,000, but the market didn’t free-fall. Bulls defended the $85,000 zone, printing a low at $85,151. Since then, Bitcoin has been consolidating below the 23.6% Fibonacci retracement of the drop from the $93,560 swing high to the $85,151 low — a clue that the bounce is still shallow and that sellers haven’t fully backed off yet. Structurally, BTC is still on the back foot: It’s trading below $88,000, and It remains below the 100-hour Simple Moving Average, keeping short-term trend pressure pointed downward. Resistance is layered, and $89,000 is the problem area(h3) If bulls try to turn this into a recovery, they’ll have to climb through multiple ceilings in quick succession. First, BTC faces resistance around $87,150, followed by a more meaningful barrier near $87,500. From there, the market’s attention snaps back to $88,000 — the level BTC just lost and now needs to reclaim. A close back above $88,000 would improve the tone, but it doesn’t solve the bigger issue: there’s a bearish trend line on the hourly BTC/USD chart (Kraken feed) with resistance near $89,000, which also lines up with the next technical hurdle. If BTC can push through $89,000 and hold, the rebound could extend toward $90,000, with follow-through targets at $91,000 and $91,500. But until price clears that $88,000–$89,000 zone, rallies are at risk of being sold rather than chased. If BTC fails to reclaim resistance, the downside path is clear(h3) The near-term bear case is simple: if Bitcoin can’t climb back above the $87,000 area and keep traction, sellers may attempt another leg lower. Support levels line up like this: Immediate support: $85,500 First major support: $85,000 Next support: $83,500 Then $82,500 in the near term Below that, the major “don’t break this” level is still $80,000. If BTC slips under $80,000, the risk of acceleration to the downside increases significantly — not because it’s magic, but because it’s the kind of psychological and structural level that tends to trigger forced de-risking. Indicators: momentum still leans bearish(h3) The intraday indicators aren’t offering much comfort yet: Hourly MACD is losing pace in the bearish zone. Hourly RSI remains below 50, suggesting sellers still have the upper hand on short timeframes. So while the $85,000 defense held for now, the market hasn’t flipped bullish — it’s just stopped bleeding.
Author  Mitrade
9 hours ago
Bitcoin has dropped back below $88,000 after rolling over from $90,500, with price still trading under the 100-hour Simple Moving Average. The sell-off found a floor at $85,151, and BTC is now consolidating near that base, but rebounds are facing pressure from a bearish trend line around $89,000. Bulls need to retake $88,000–$89,000 to ease downside risk; failure to do so keeps $85,500–$85,000 and then $83,500 in play, with $80,000 as the deeper “line in the sand.” Bitcoin (BTC) is back in damage-control mode after a sharp pullback wiped out recent gains. The price failed to reclaim the $90,000–$90,500 band, rolled over, and slid through $88,500 before briefly dipping under $87,000. Buyers did show up around $85,000, but the rebound so far looks more like stabilization than a clear trend reversal. Bitcoin dips hard, finds a bid near $85,000(h3) BTC’s latest move lower began when it couldn’t build follow-through above $90,000 and $90,500. Once that upside stalled, sellers took control and pushed price down through $88,500. The slide accelerated enough to spike below $87,000, but the market didn’t free-fall. Bulls defended the $85,000 zone, printing a low at $85,151. Since then, Bitcoin has been consolidating below the 23.6% Fibonacci retracement of the drop from the $93,560 swing high to the $85,151 low — a clue that the bounce is still shallow and that sellers haven’t fully backed off yet. Structurally, BTC is still on the back foot: It’s trading below $88,000, and It remains below the 100-hour Simple Moving Average, keeping short-term trend pressure pointed downward. Resistance is layered, and $89,000 is the problem area(h3) If bulls try to turn this into a recovery, they’ll have to climb through multiple ceilings in quick succession. First, BTC faces resistance around $87,150, followed by a more meaningful barrier near $87,500. From there, the market’s attention snaps back to $88,000 — the level BTC just lost and now needs to reclaim. A close back above $88,000 would improve the tone, but it doesn’t solve the bigger issue: there’s a bearish trend line on the hourly BTC/USD chart (Kraken feed) with resistance near $89,000, which also lines up with the next technical hurdle. If BTC can push through $89,000 and hold, the rebound could extend toward $90,000, with follow-through targets at $91,000 and $91,500. But until price clears that $88,000–$89,000 zone, rallies are at risk of being sold rather than chased. If BTC fails to reclaim resistance, the downside path is clear(h3) The near-term bear case is simple: if Bitcoin can’t climb back above the $87,000 area and keep traction, sellers may attempt another leg lower. Support levels line up like this: Immediate support: $85,500 First major support: $85,000 Next support: $83,500 Then $82,500 in the near term Below that, the major “don’t break this” level is still $80,000. If BTC slips under $80,000, the risk of acceleration to the downside increases significantly — not because it’s magic, but because it’s the kind of psychological and structural level that tends to trigger forced de-risking. Indicators: momentum still leans bearish(h3) The intraday indicators aren’t offering much comfort yet: Hourly MACD is losing pace in the bearish zone. Hourly RSI remains below 50, suggesting sellers still have the upper hand on short timeframes. So while the $85,000 defense held for now, the market hasn’t flipped bullish — it’s just stopped bleeding.
goTop
quote