EUR/GBP Price Forecast: Finds support at bottom of range

Source Fxstreet
  • EUR/GBP has met support at the floor of a five-week range. 
  • It will probably recover as the pair extends its range sideways. 

EUR/GBP has fallen down to the base of its six-week range (red dashed line on chart) at roughly 0.8311; it is likely encountering firm support at that level.

EUR/GBP 4-hour Chart 

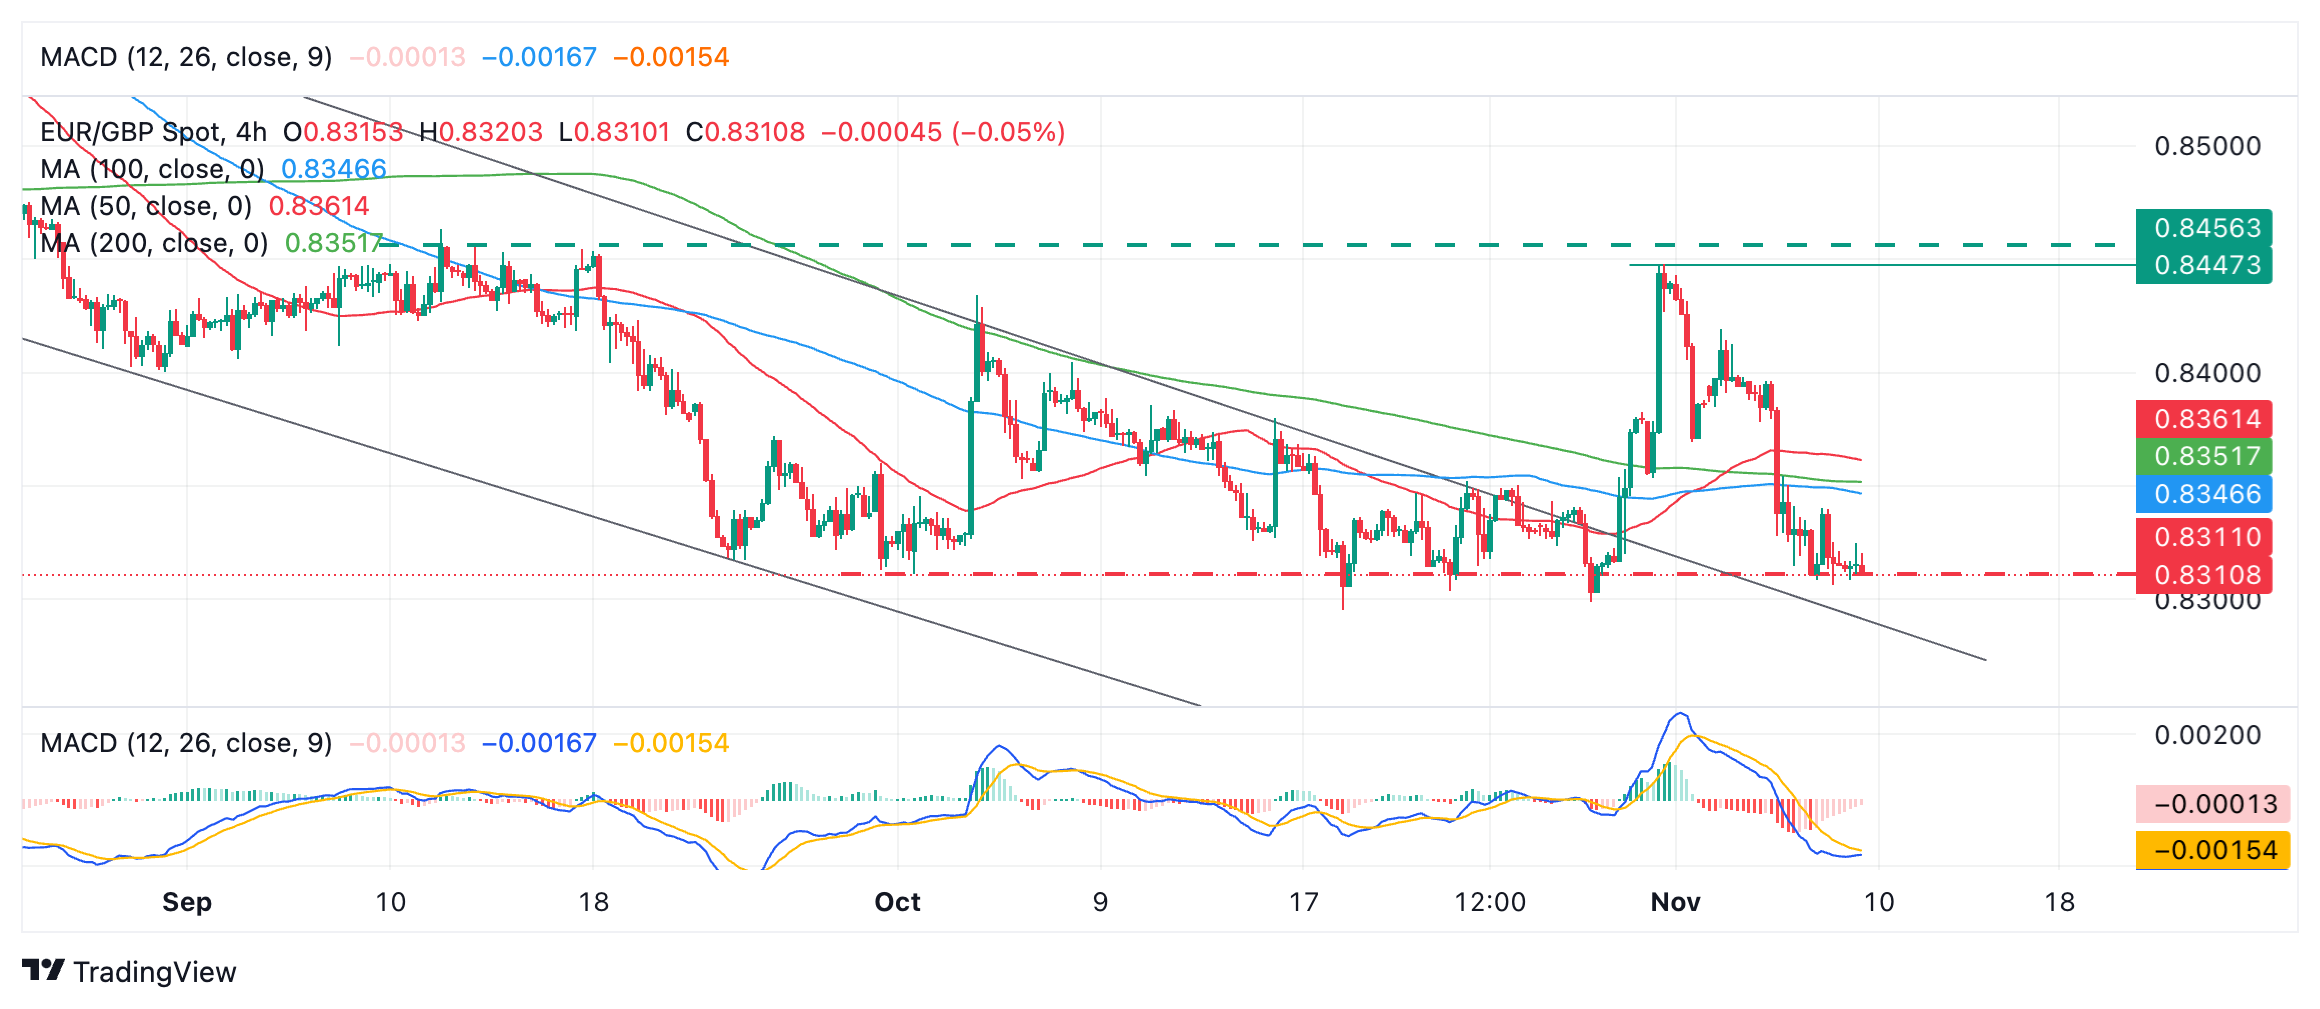
The pair is probably in a sideways trend on a short-term basis and given the technical analysis maxim that “the trend is your friend” the odds favor an extension of this range-bound price action. 

As such, EUR/GBP will probably bounce off the range floor and start to rise back up within the range thereby extending the sideways trend. 

If EUR/GBP breaks decisively below the 0.8311 floor, however, it would suggest the medium and long-term downtrends were reasserting themselves.  

A longer-than-average daily candlestick below the 0.8311 lows, or perhaps three consecutive red candles that break below the level, would confirm a decisive breakdown. Such a move would probably lead to a sell-off to around the 0.8240 level, this being the 61.8% Fibonacci extension of the height of the range extrapolated lower. 


Disclaimer: For information purposes only. Past performance is not indicative of future results.
placeholder
Nvidia Q1 Revenue Surges 85%, Data Center Business Accounts for 90%, Blowout Results Fail to Stop Stock VolatilityAs the absolute leader in the global AI industry chain, NVIDIA ( NVDA) delivered a quarterly earnings report that surpassed Wall Street's general expectations as anticipated.After the mar
Author  TradingKey
9 hours ago
As the absolute leader in the global AI industry chain, NVIDIA ( NVDA) delivered a quarterly earnings report that surpassed Wall Street's general expectations as anticipated.After the mar
placeholder
Is US-Iran Conflict About to End? Crude Oil Plummets, Gold Hits $4,500Tensions between the US and Iran showed clear signs of easing on Wednesday (May 20), leading to a plunge in the crude oil market while gold ( XAUUSD) continued its rally.WTI crude oil dai
Author  TradingKey
13 hours ago
Tensions between the US and Iran showed clear signs of easing on Wednesday (May 20), leading to a plunge in the crude oil market while gold ( XAUUSD) continued its rally.WTI crude oil dai
placeholder
Gold holds steady near $4,550 as market eyes Middle East developmentsGold price (XAU/USD) trades on a flat note around $4,540 during the early Asian session on Thursday. Traders continue to assess the developments surrounding stalled US-Iran peace negotiations and threats to the Strait of Hormuz.
Author  FXStreet
17 hours ago
Gold price (XAU/USD) trades on a flat note around $4,540 during the early Asian session on Thursday. Traders continue to assess the developments surrounding stalled US-Iran peace negotiations and threats to the Strait of Hormuz.
placeholder
Nvidia Earnings Approach: Can It Drive a Nasdaq Rebound? What Should Investors Watch Most?On May 20, ET, NVIDIA ( NVDA )'s first-quarter fiscal 2026 earnings report, to be released after the market close, has become the market focus. The options market has already reacted; bas
Author  TradingKey
Yesterday 10: 33
On May 20, ET, NVIDIA ( NVDA )'s first-quarter fiscal 2026 earnings report, to be released after the market close, has become the market focus. The options market has already reacted; bas
placeholder
Gold Prices Fall Below Key $4,500 Mark, US Treasury Yields Rise for Seventh Day, Gold May Fall to $4,100On Tuesday (May 19), gold ( XAUUSD) closed at $4,481.89. The price confirmed a break below $4,500, further opening up the downside. On Wednesday, gold extended its downward trend from the
Author  TradingKey
Yesterday 03: 34
On Tuesday (May 19), gold ( XAUUSD) closed at $4,481.89. The price confirmed a break below $4,500, further opening up the downside. On Wednesday, gold extended its downward trend from the
Related Instrument
goTop
quote