


EUR/USD skids into fresh ten-week low, taps 1.09 as ECB rate cut looms
- EUR/USD is set to decline for a third straight week against the Greenback.
- Fiber kicked off the new trading week finding fresh lows as Euro confidence wanes.
- ECB is set to trim rates by another 25 bps this week.
EUR/USD hit a fresh ten-week low on Monday, kicking off a new trading week with renewed declines. The Euro shed one-quarter of one percent against the Greenback, knocking into the 200-day Exponential Moving Average (EMA) as USD strength parlays with a broadly weakening EUR.
The latest European Central Bank (ECB) Lending Survey results are expected early Tuesday, and investors will be looking for any hints about the overall health of the pan-European banking sector this week.
Final European Harmonized Index of Consumer Prices (HICP) inflation figures are due early Thursday, but they are unlikely to drive much volatility as markets watch the European Central Bank (ECB), which is broadly expected to trim interest rates by 25 basis points, also on Thursday.
Meaningful US data isn’t due until Thursday’s US Retail Sales, expected to accelerate to 0.3% MoM in September after August’s lackluster 0.1%.
EUR/USD price forecast
EUR/USD is succumbing to clear bearish pressure, with the pair falling into the 200-day EMA and backsliding into the 1.0900 handle at the same time. The Fiber has tumbled nearly 3% top-to-bottom from late September’s peaks just above 1.1200, and the pair has closed in the red for all but four of the last 13 straight trading days.
The price action around the 200-day EMA will be critical in determining the near-term direction of EUR/USD. A sustained break below this level could open the door to further downside, with the next support zone seen around the 1.0850 level. On the other hand, if the pair manages to reclaim the 200-day EMA and move back above 1.09063, it might alleviate some of the immediate bearish pressure. However, the 50-day EMA remains a key resistance level that needs to be breached for any sustained bullish reversal.
The technical outlook remains bearish as long as the pair stays below the 50-day EMA. While the 200-day EMA at 1.09063 may provide some temporary support, the current trend suggests continued downside risks in the near term. The lack of a strong bullish catalyst means the pair could remain under pressure, and traders will be watching for further signs of weakness, especially if the pair remains below key moving averages.
EUR/USD daily chart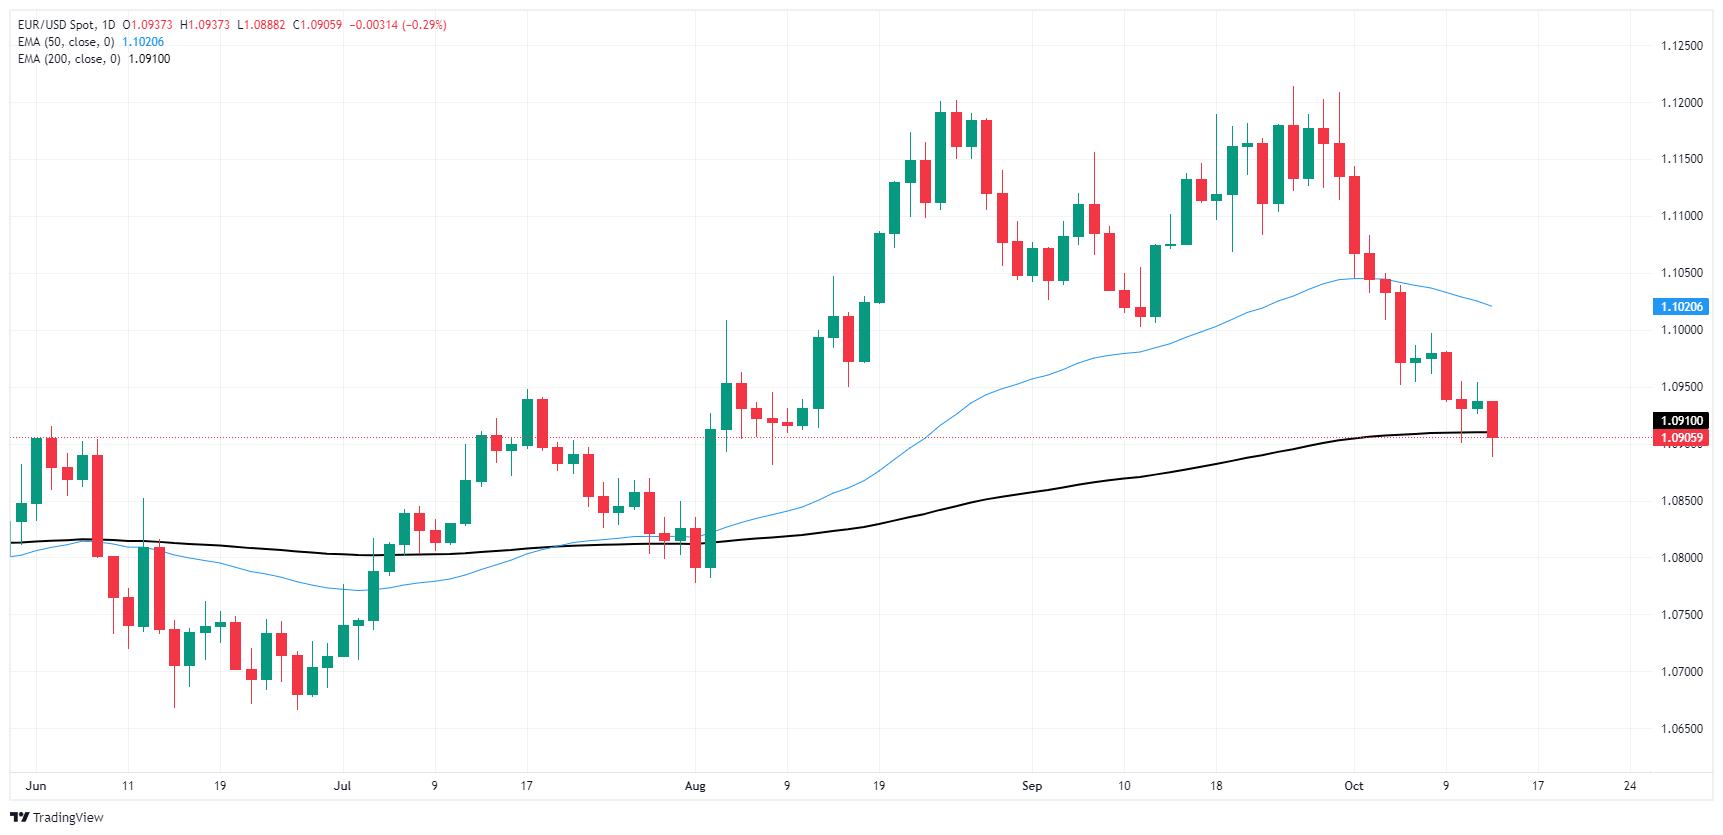
Euro FAQs
The Euro is the currency for the 19 European Union countries that belong to the Eurozone. It is the second most heavily traded currency in the world behind the US Dollar. In 2022, it accounted for 31% of all foreign exchange transactions, with an average daily turnover of over $2.2 trillion a day. EUR/USD is the most heavily traded currency pair in the world, accounting for an estimated 30% off all transactions, followed by EUR/JPY (4%), EUR/GBP (3%) and EUR/AUD (2%).
The European Central Bank (ECB) in Frankfurt, Germany, is the reserve bank for the Eurozone. The ECB sets interest rates and manages monetary policy. The ECB’s primary mandate is to maintain price stability, which means either controlling inflation or stimulating growth. Its primary tool is the raising or lowering of interest rates. Relatively high interest rates – or the expectation of higher rates – will usually benefit the Euro and vice versa. The ECB Governing Council makes monetary policy decisions at meetings held eight times a year. Decisions are made by heads of the Eurozone national banks and six permanent members, including the President of the ECB, Christine Lagarde.
Eurozone inflation data, measured by the Harmonized Index of Consumer Prices (HICP), is an important econometric for the Euro. If inflation rises more than expected, especially if above the ECB’s 2% target, it obliges the ECB to raise interest rates to bring it back under control. Relatively high interest rates compared to its counterparts will usually benefit the Euro, as it makes the region more attractive as a place for global investors to park their money.
Data releases gauge the health of the economy and can impact on the Euro. Indicators such as GDP, Manufacturing and Services PMIs, employment, and consumer sentiment surveys can all influence the direction of the single currency. A strong economy is good for the Euro. Not only does it attract more foreign investment but it may encourage the ECB to put up interest rates, which will directly strengthen the Euro. Otherwise, if economic data is weak, the Euro is likely to fall. Economic data for the four largest economies in the euro area (Germany, France, Italy and Spain) are especially significant, as they account for 75% of the Eurozone’s economy.
Another significant data release for the Euro is the Trade Balance. This indicator measures the difference between what a country earns from its exports and what it spends on imports over a given period. If a country produces highly sought after exports then its currency will gain in value purely from the extra demand created from foreign buyers seeking to purchase these goods. Therefore, a positive net Trade Balance strengthens a currency and vice versa for a negative balance.
Recommended Articles


