

USD/JPY Price Forecast: The peaks and troughs keep rising
Source Fxstreet
- USD/JPY continues rising in a short and probably medium-term trend higher.
- It is overbought according to RSI, however, and could pull-back to support temporarily.
USD/JPY has been steadily rising since the mid-September 140 lows. It is now in the 149s and appears to have established a short – and probably – medium-term uptrend. Given the premise that “the trend is your friend” the odds favor a continuation higher.
USD/JPY 4-hour Chart
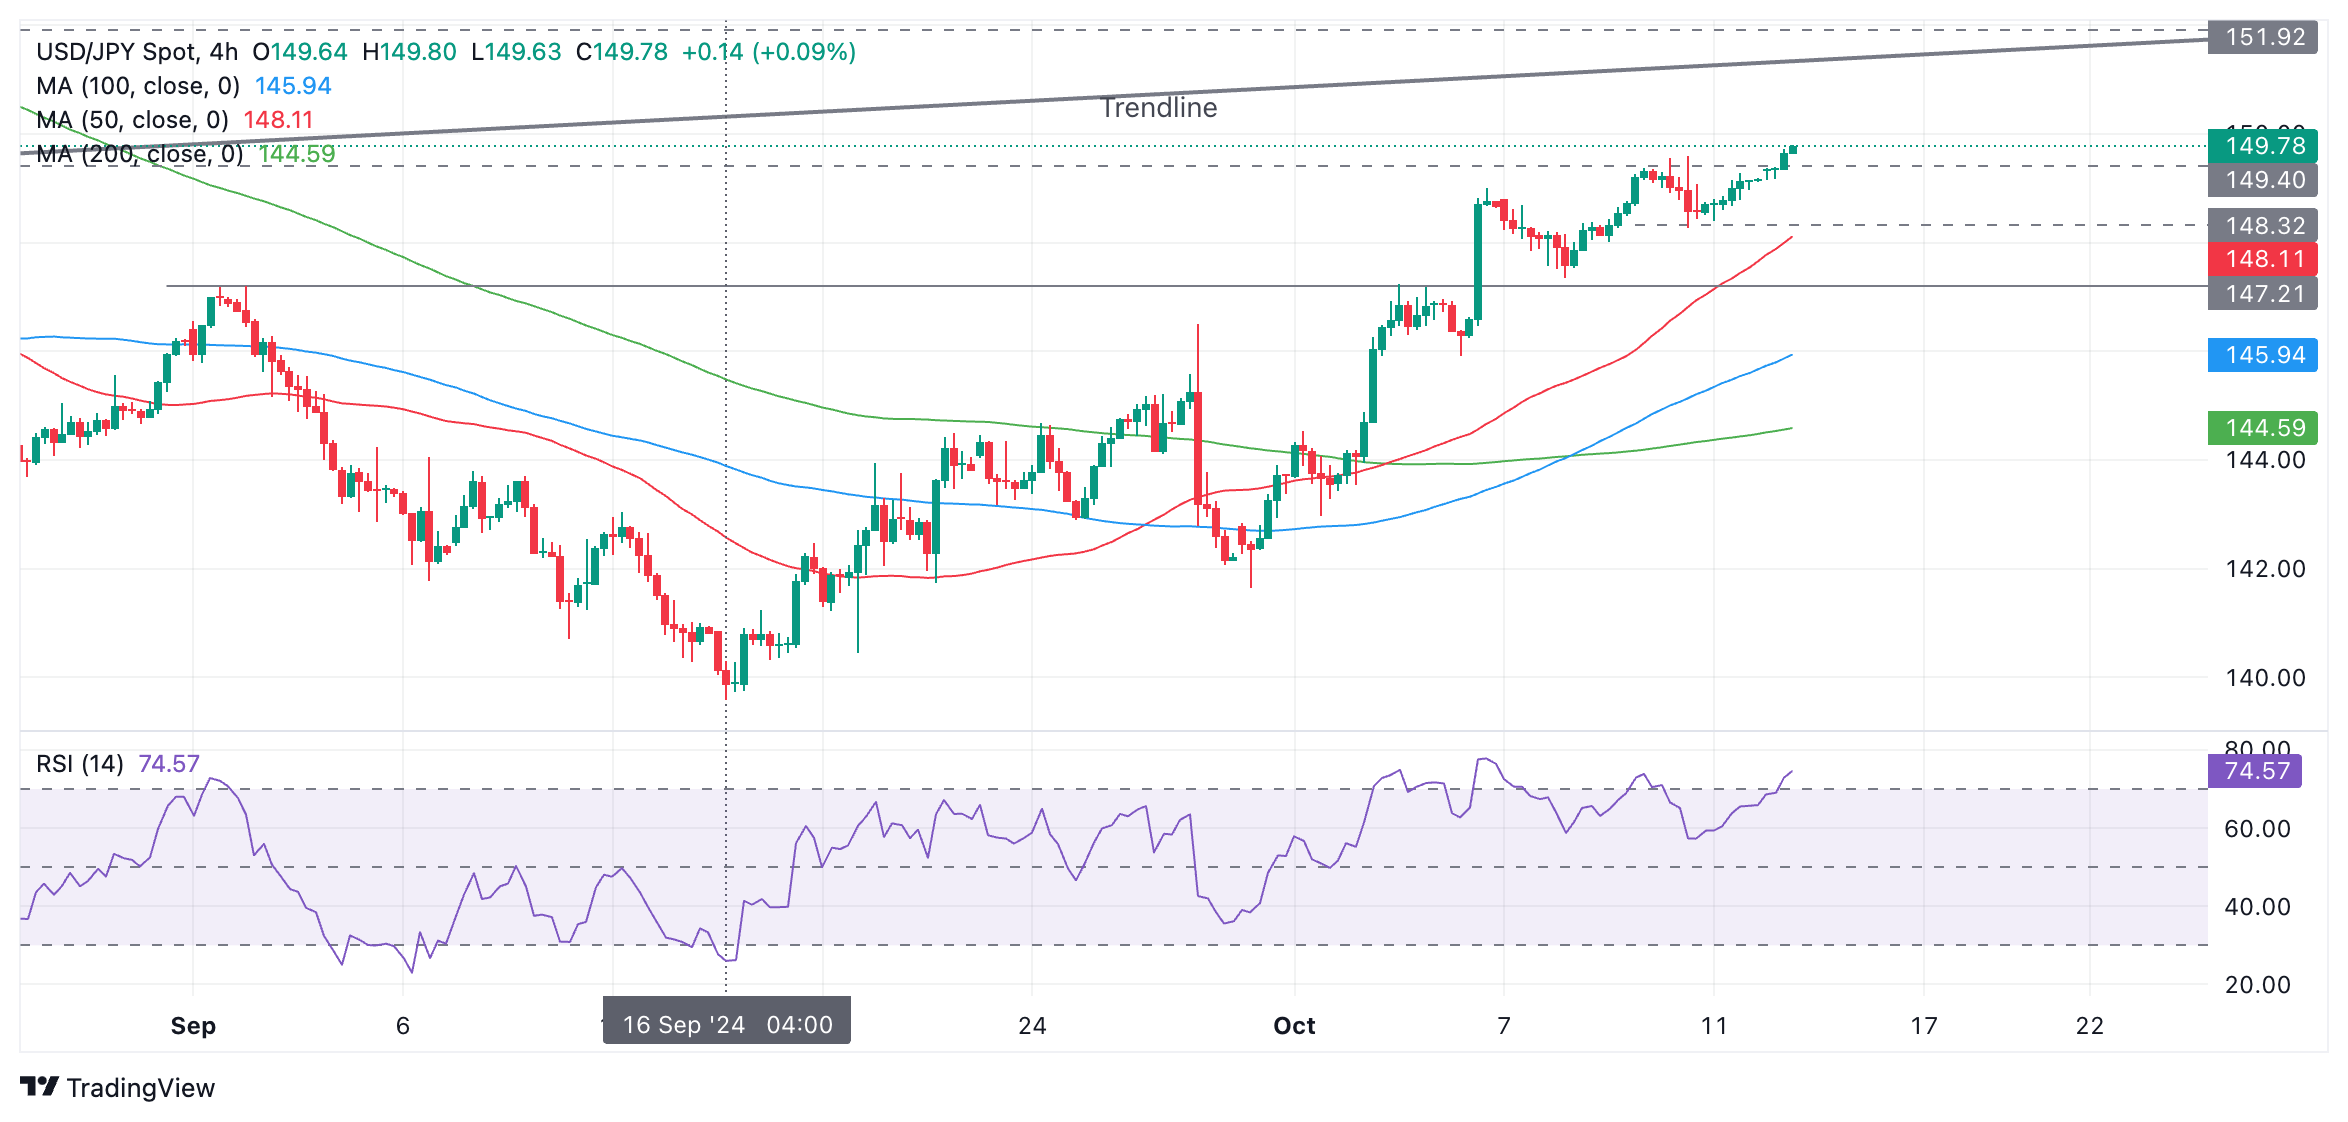
The next target lies at 151.09 and the 200-day Simple Moving Average (SMA) (not shown), followed by the major trendline in the 151.80s.
The pair is overbought, however, according to the Relative Strength Index (RSI) momentum indicator and this means long-holders should not add to their positions as there is a risk of a pull back.
If RSI exists overbought it will signal a correction, probably to support at either 149.40 or 148.32 if deeper.
Disclaimer: For information purposes only. Past performance is not indicative of future results.
Recommended Articles

Bitcoin fell sharply last week, testing the short-term defense line at $62,000, with the outcome of US-Iran negotiations becoming a key factor.On August 3, Bitcoin ( BTC) extended its rec
International oil prices plunged during Asian trading hours on Monday. US President Donald Trump announced a suspension of a new round of military action against Iran and plans to restart
US President Donald Trump says Iran talks to begin Monday after canceling attackUS President Donald Trump said that fresh round of Iran talks would begin Monday after he cancelled a planned attack on Iran partially in response to pleas from US allies in the Middle East, including Saudi Arabia, Bloomberg reported on Monday.
US President Donald Trump said that fresh round of Iran talks would begin Monday after he cancelled a planned attack on Iran partially in response to pleas from US allies in the Middle East, including Saudi Arabia, Bloomberg reported on Monday.
As Microsoft ( MSFT) and Google ( GOOGL) sequentially delivered stellar cloud computing report cards, Amazon ( AMZN) also proved with an earnings report that far exceeded expectations tha
WTI holds losses around $82.50 on renewed US-Iran diplomatic hopesWest Texas Intermediate (WTI) oil price remains in the negative territory for the second successive day, trading around $82.60 per barrel during the Asian hours on Friday. Crude oil prices have lost ground following renewed hopes for a diplomatic solution to the US-Iran conflict.
West Texas Intermediate (WTI) oil price remains in the negative territory for the second successive day, trading around $82.60 per barrel during the Asian hours on Friday. Crude oil prices have lost ground following renewed hopes for a diplomatic solution to the US-Iran conflict.
Related Instrument


