

GBP/JPY Price Forecast: sellers take control below 50-day SMA

Source Fxstreet
  • GBP/JPY falls below 50-day SMA after failing near 216.00.
  • Bearish RSI signals sellers are gaining control of momentum.
  • Break below 214.75 exposes 212.45 and August low.

The GBP/JPY retreats on Wednesday as the cross-pair fails to climb past 216.00  and fell beneath the 50-day Simple Moving Average (SMA) of 125.56. The cross-pair trades at 214.25 down 0.37%.

GBP/JPY Price Forecast: Technical outlook

The GBP/JPY is neutral biased, with the pair holding below the 50-day SMA, with traders eyeing the 100-day SMA at 214.75, which could’ve opened the door for further losses. The next support would be the 200-day SMA at 212.45, followed by the August 7 low of 211.47.

The Relative Strength Index (RSI) reveals that sellers are gaining momentum, an indication that bears are in control.

On further strength, the GBP/JPY first resistance is the April 10 high of 216.60, followed by 217.’00. Above this area ists the July 10 high of 218.69, ahead of the July 15 high at 219.61.

GBP/JPY Price Chart – Daily
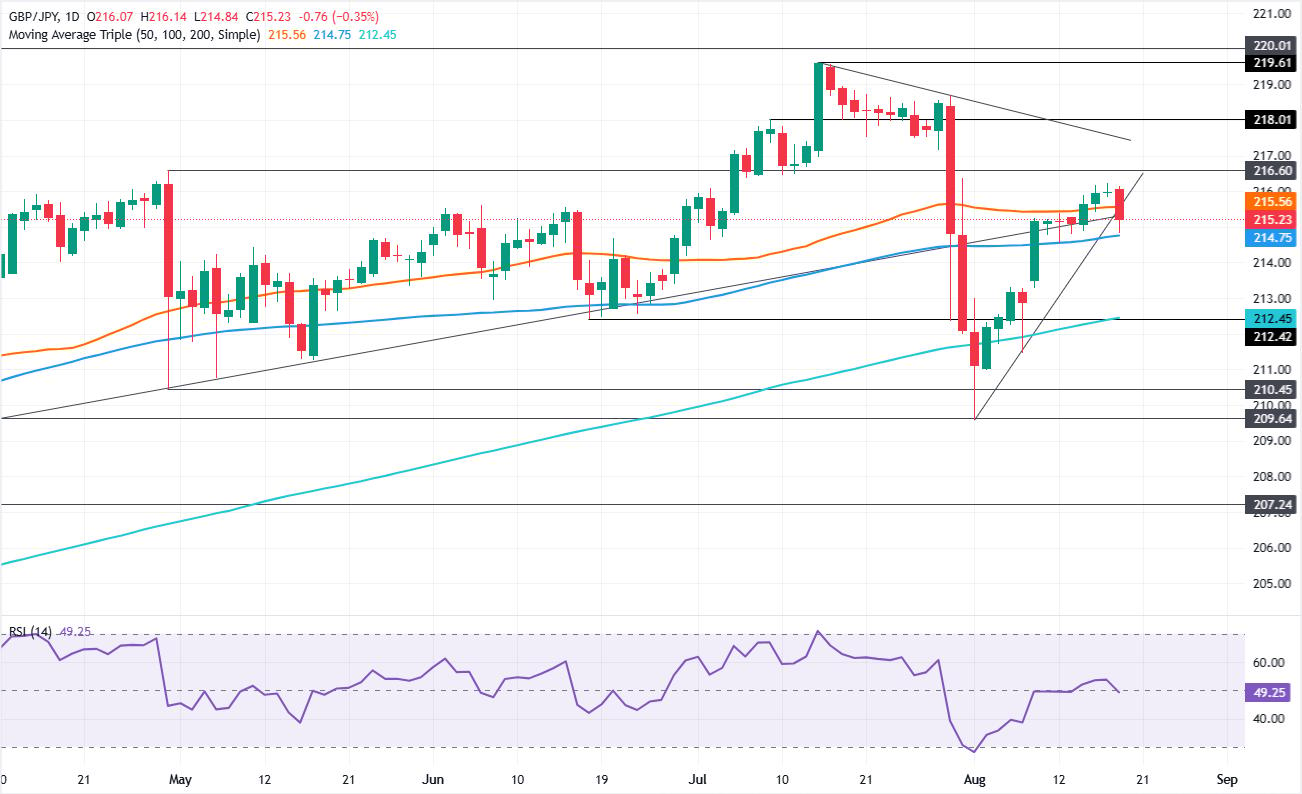
GBP/JPY daily chart

Pound Sterling Price Today

The table below shows the percentage change of British Pound (GBP) against listed major currencies today. British Pound was the strongest against the US Dollar.

USD EUR GBP JPY CAD AUD NZD CHF
USD -0.85% -0.50% -0.89% -0.64% -0.52% -0.99% -1.80%
EUR 0.85% 0.33% -0.04% 0.21% 0.31% -0.20% -0.97%
GBP 0.50% -0.33% -0.34% -0.13% -0.02% -0.51% -1.31%
JPY 0.89% 0.04% 0.34% 0.23% 0.34% -0.15% -0.96%
CAD 0.64% -0.21% 0.13% -0.23% 0.11% -0.38% -1.19%
AUD 0.52% -0.31% 0.02% -0.34% -0.11% -0.49% -1.28%
NZD 0.99% 0.20% 0.51% 0.15% 0.38% 0.49% -0.80%
CHF 1.80% 0.97% 1.31% 0.96% 1.19% 1.28% 0.80%

The heat map shows percentage changes of major currencies against each other. The base currency is picked from the left column, while the quote currency is picked from the top row. For example, if you pick the British Pound from the left column and move along the horizontal line to the US Dollar, the percentage change displayed in the box will represent GBP (base)/USD (quote).

Disclaimer: For information purposes only. Past performance is not indicative of future results.
placeholder
ECB Policy Outlook for 2026: What It Could Mean for the Euro’s Next MoveWith the ECB likely holding rates steady at 2.15% and the Fed potentially extending cuts into 2026, EUR/USD may test 1.20 if Eurozone growth proves resilient, but weaker growth and an ECB pivot could pull the pair back toward 1.13 and potentially 1.10.
Author  Mitrade
Dec 26, 2025
With the ECB likely holding rates steady at 2.15% and the Fed potentially extending cuts into 2026, EUR/USD may test 1.20 if Eurozone growth proves resilient, but weaker growth and an ECB pivot could pull the pair back toward 1.13 and potentially 1.10.
placeholder
Bitcoin Price Forecast: Persistent ETF inflows, easing Middle East tensions lift risk appetiteBitcoin (BTC) extends its gains, trading above $64,800 at the time of writing on Thursday, breaking above the key resistance zone. Institutional demand supports BTC price action with spot Exchange Traded Funds (ETFs) recording a third consecutive day of inflows so far this week.
Author  FXStreet
Aug 06, Thu
Bitcoin (BTC) extends its gains, trading above $64,800 at the time of writing on Thursday, breaking above the key resistance zone. Institutional demand supports BTC price action with spot Exchange Traded Funds (ETFs) recording a third consecutive day of inflows so far this week.
placeholder
Gold Price Forecast: Gold May Break $4,500 as Fed Rate-Hike Expectations Continue to CoolAs of the European session on August 17, gold prices (XAUUSD) were trading above $4,400, up about 0.7% on the day and reaching an intraday high of $4,416.43, extending last Friday's gains
Author  TradingKey
Aug 17, Mon
As of the European session on August 17, gold prices (XAUUSD) were trading above $4,400, up about 0.7% on the day and reaching an intraday high of $4,416.43, extending last Friday's gains
placeholder
WTI consolidates below $84.50, two-week top as bullish bias remains amid Hormuz standoffWest Texas Intermediate (WTI) – the benchmark US Crude Oil price – extends its consolidative price move through the first half of the European session and currently trades near the $84.25-$84.30 area, close to a two-week high set earlier this Tuesday.
Author  FXStreet
Aug 18, Tue
West Texas Intermediate (WTI) – the benchmark US Crude Oil price – extends its consolidative price move through the first half of the European session and currently trades near the $84.25-$84.30 area, close to a two-week high set earlier this Tuesday.
placeholder
WTI rises to near $85.00 amid escalating US-Iran tensionsWest Texas Intermediate (WTI) oil price extends its gains for the fourth consecutive day, trading around $84.80 per barrel during the Asian hours on Wednesday.
Author  FXStreet
Yesterday 02: 03
West Texas Intermediate (WTI) oil price extends its gains for the fourth consecutive day, trading around $84.80 per barrel during the Asian hours on Wednesday.
Related Instrument
goTop
quote