NZD/USD Price Analysis: Neutral outlook as bulls and bear fight for the lead

Source Fxstreet
  • The NZD/USD upside seems to be limited as buying and selling forces struggle for dominance.
  • The RSI suggests a neutral outlook, while the MACD indicates declining selling pressure.
  • A crossover between the 100 and 200-day SMA might propel the pair upwards.

The NZD/USD traded mostly flat on Friday’s session and failed to hold gain which took it to a high around 0.6260 as it then retreated to 0.6240.

The Relative Strength Index (RSI) is at 61, in positive territory with a flat slope. This indicates a neutral outlook for the pair, as buying pressure is flat. The Moving Average Convergence Divergence (MACD) histogram is red and decreasing, suggesting that selling pressure is declining.

NZD/USD daily chart

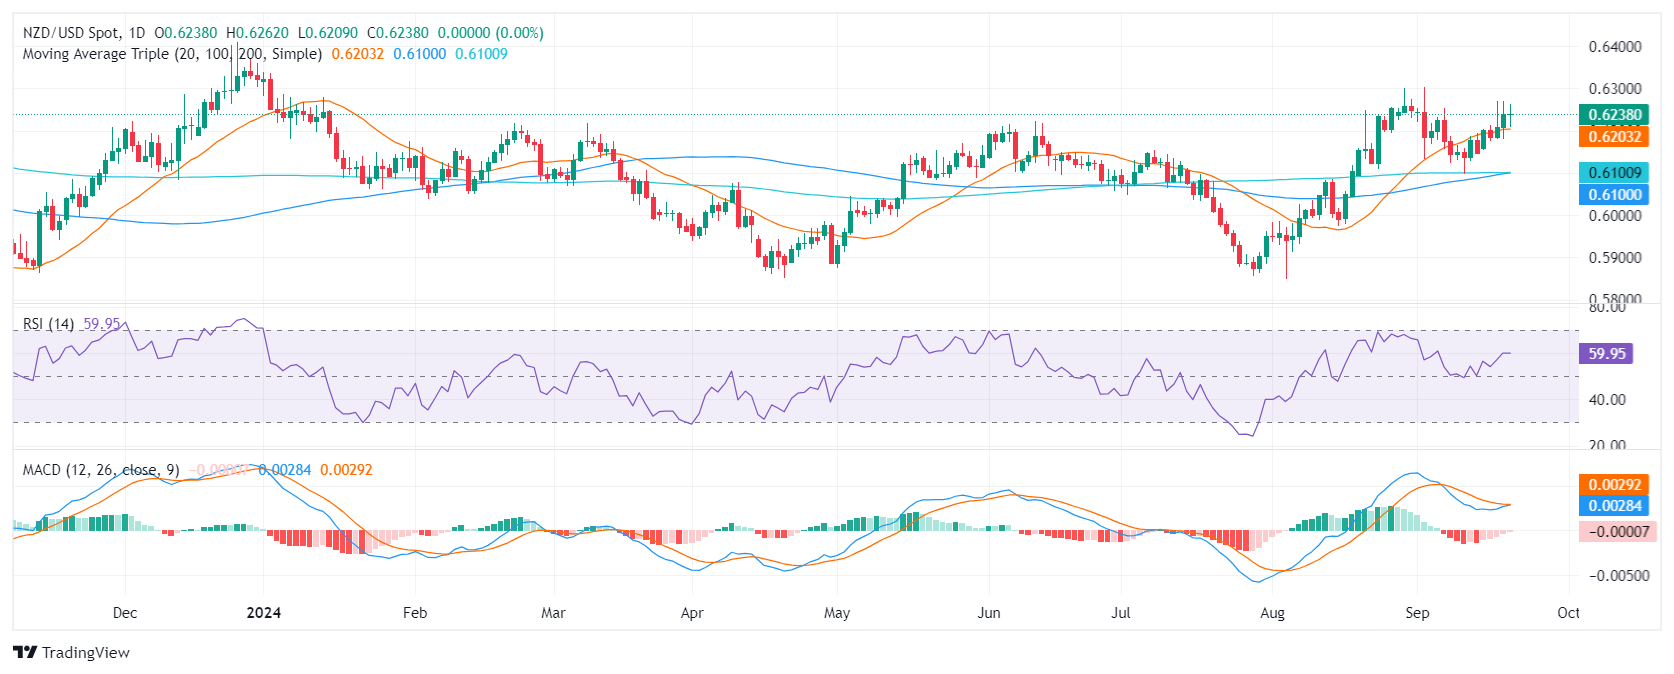
Key support levels include 0.6150, 0.6120, and 0.6100, while resistance levels are 0.6190, 0.6200, and 0.6230. A close above the 20-day SMA, currently at 0.6200, could signal further upward movement with the next target being at early September highs near 0.6300. In addition, traders should monitor the 0.6100 area as the 100 and 200-day SMAs are about to perform a bullish crossover. That could serve as a bullish confirmation and might trigger another upwards leg.


Disclaimer: For information purposes only. Past performance is not indicative of future results.
placeholder
$180 Oil Prices Imminent? Saudi Arabia Warns: Crisis to Last Until Late April, Oil Prices Will Break Historic HighsThe continuous escalation of geopolitical conflicts in the Middle East is pushing global energy markets toward their most severe test in nearly 20 years.The Wall Street Journal reports th
Author  TradingKey
Yesterday 10: 11
The continuous escalation of geopolitical conflicts in the Middle East is pushing global energy markets toward their most severe test in nearly 20 years.The Wall Street Journal reports th
placeholder
Gold tumbles below $4,650 as inflation fears and liquidity squeeze weighGold price (XAU/USD) remains under selling pressure near $4,640 during the early Asian session on Friday. The precious metal extends the decline as soaring crude oil and energy prices, driven by the escalating US-Israeli war with Iran, reignite inflation fears.
Author  FXStreet
Yesterday 01: 22
Gold price (XAU/USD) remains under selling pressure near $4,640 during the early Asian session on Friday. The precious metal extends the decline as soaring crude oil and energy prices, driven by the escalating US-Israeli war with Iran, reignite inflation fears.
placeholder
Bitcoin Drops Below $70,000 as Crypto Rally Fails to MaterializeThe crypto market experienced a significant pullback, Bitcoin (BTCUSD) fell below the key $70,000 mark during intraday trading, triggering short-term stop-loss orders and causing market s
Author  TradingKey
Mar 19, Thu
The crypto market experienced a significant pullback, Bitcoin (BTCUSD) fell below the key $70,000 mark during intraday trading, triggering short-term stop-loss orders and causing market s
placeholder
Gold falls below $4,850 as Fed holds rates steadyGold price (XAU/USD) faces some selling pressure near $4,830 during the early Asian session on Thursday.
Author  FXStreet
Mar 19, Thu
Gold price (XAU/USD) faces some selling pressure near $4,830 during the early Asian session on Thursday.
placeholder
WTI Crude Prices Capped at $100, Has the Rally Ended? How to Trade the Short Term? Today (March 18), WTI crude oil continued to exhibit significant short-term volatility, driven by a tug-of-war between headlines and data. Intraday, prices retreated from Tuesday's high o
Author  TradingKey
Mar 18, Wed
Today (March 18), WTI crude oil continued to exhibit significant short-term volatility, driven by a tug-of-war between headlines and data. Intraday, prices retreated from Tuesday's high o
Related Instrument
goTop
quote