GBP/JPY Price Forecast: Up move takes root after BoE decision

Source Fxstreet
  • GBP/JPY pivoted on September 11 and started moving higher. 
  • This new up move has extended following the BoE decision to leave interest rates unchanged.
     

GBP/JPY formed a Hammer candlestick reversal pattern at the September 11 lows and has been pushing higher ever since. It has had an extra left on Thursday following the Bank of England (BoE) interest rate decision.

GBP/JPY Daily Chart 


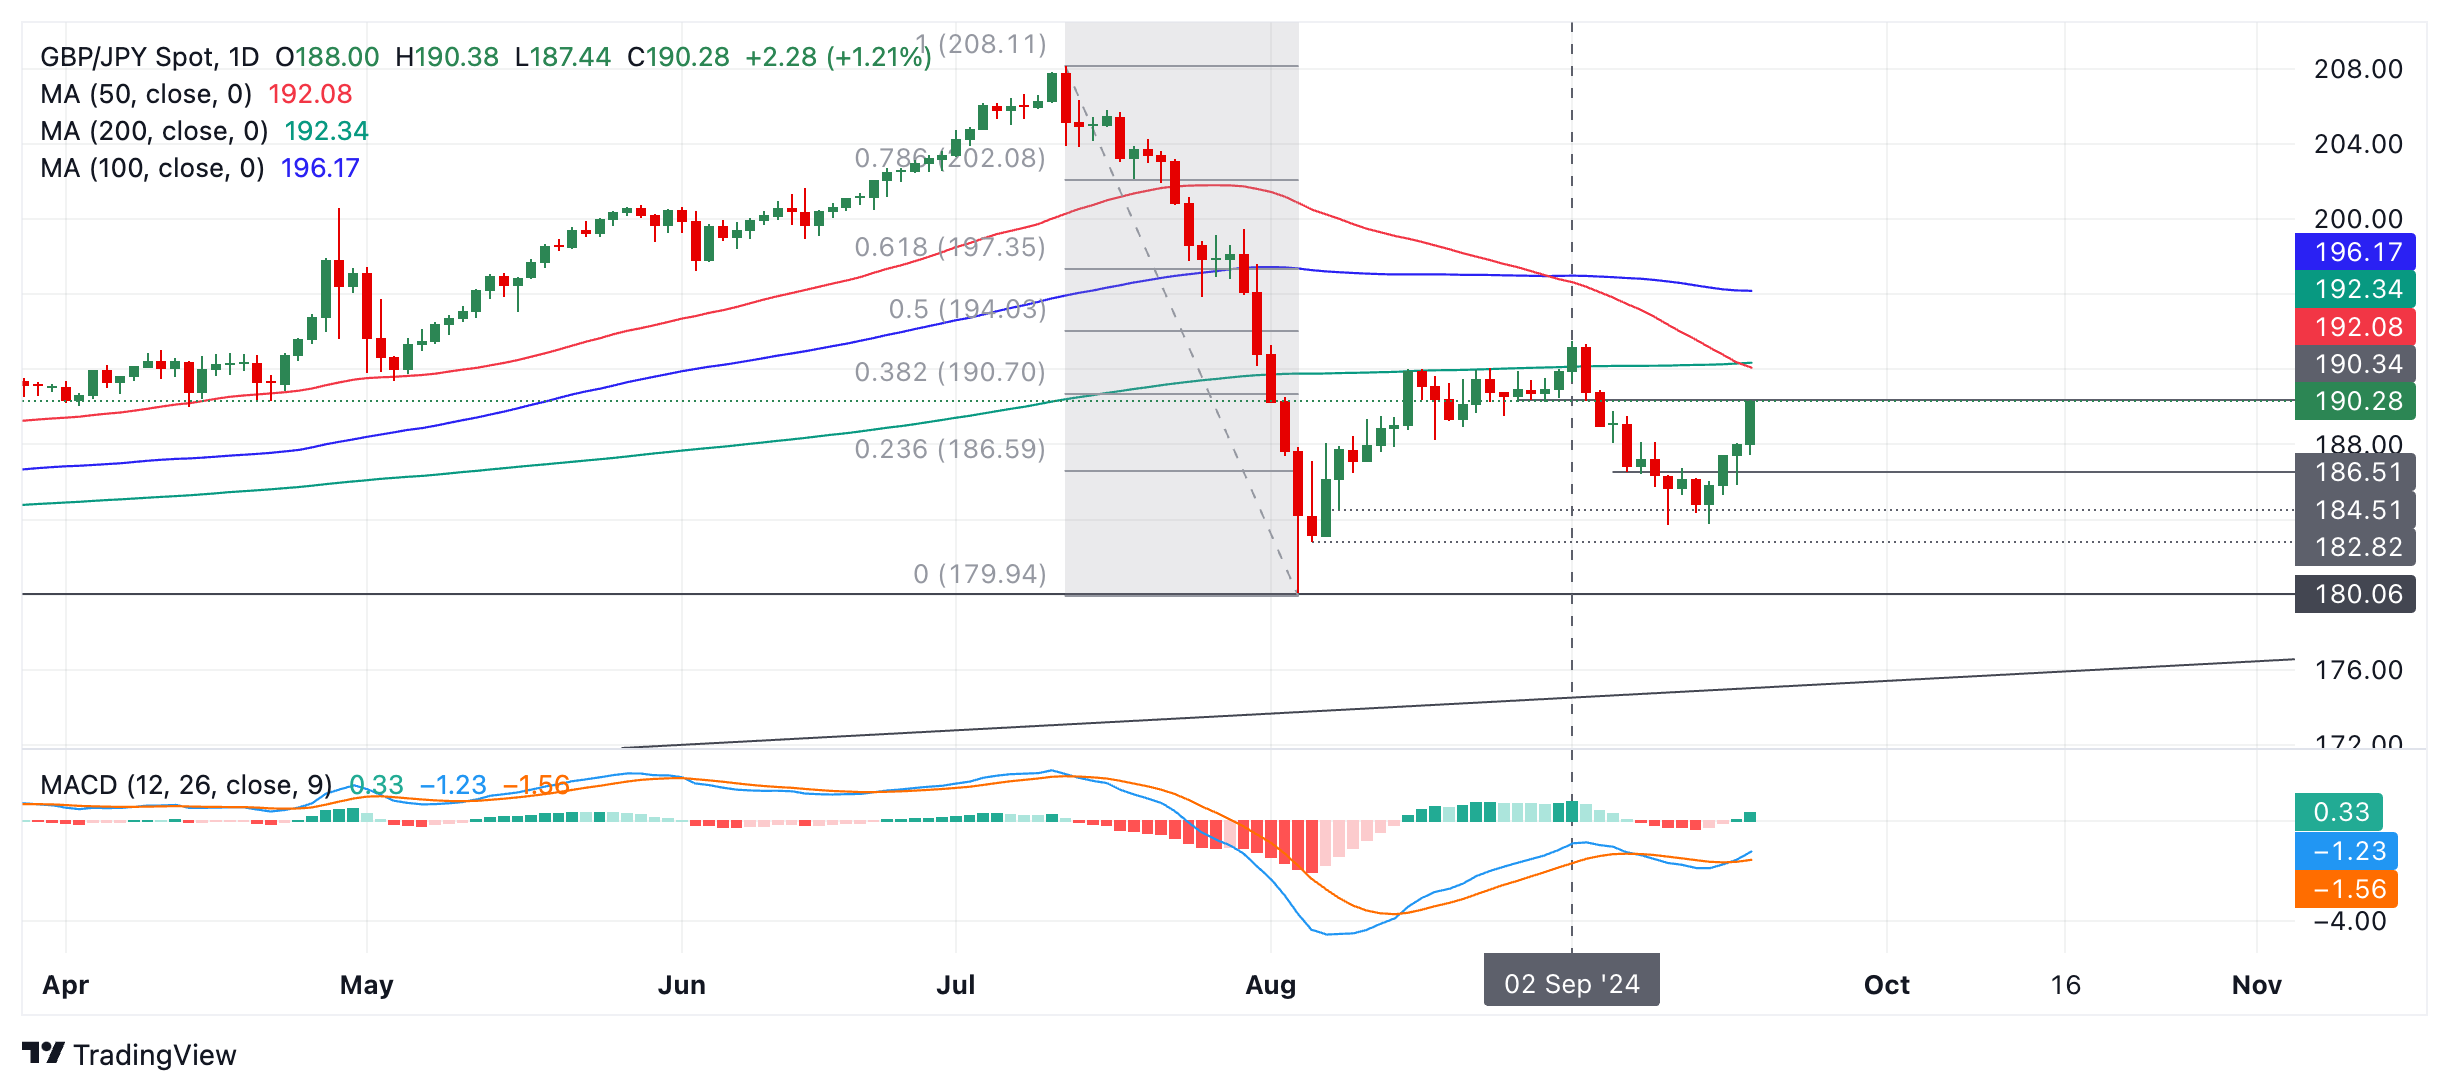
A new short-term uptrend appears to have formed and is carrying GBP/JPY higher. It is currently hitting support-turned-resistance at 190.34 and could stall. If it decisively breaks higher it will probably target the 50 and 200-day Simple Moving Averages at 192.08 and 190.34 respectively. These are likely to produce even more resistance and may be difficult to break above. 

The medium-term trend is sideways and chaotic providing no hints as to where the underlying current is flowing.

This suggests caution should be exercised by traders as price could flip at any moment and start moving in the opposite direction.

Disclaimer: For information purposes only. Past performance is not indicative of future results.
placeholder
BTC Hovers Near 60,000 Mark After Plunge. US May CPI Set to Be Revealed, How Is Wall Street Betting?Bitcoin's rebound falters as the U.S.-Iran conflict and CPI data likely sustain downward pressure.On June 10, escalating U.S.-Iran tensions put the already fragile crypto market to the te
Author  TradingKey
10 hours ago
Bitcoin's rebound falters as the U.S.-Iran conflict and CPI data likely sustain downward pressure.On June 10, escalating U.S.-Iran tensions put the already fragile crypto market to the te
placeholder
Gold plummets below $4,200 as US‑Iran tensions spur hawkish rate bets ahead of US CPIGold (XAU/USD) extends the recent breakdown momentum below a technically significant 200-day Simple Moving Average (SMA) and drops to a fresh low since March 23, further below the $4,200 mark during the Asian session on Wednesday.
Author  FXStreet
11 hours ago
Gold (XAU/USD) extends the recent breakdown momentum below a technically significant 200-day Simple Moving Average (SMA) and drops to a fresh low since March 23, further below the $4,200 mark during the Asian session on Wednesday.
placeholder
Gold Prices Fall for Four Consecutive Months, Has the Precious Metals Bull Market Partially Ended? Where Is the Next Support Level?Gold Prices ( XAUUSD) Slump for Four Consecutive Months: Has the Precious Metals Bull Market Partially Ended? Where Is the Next Support Level?Year-to-date, international gold prices have
Author  TradingKey
12 hours ago
Gold Prices ( XAUUSD) Slump for Four Consecutive Months: Has the Precious Metals Bull Market Partially Ended? Where Is the Next Support Level?Year-to-date, international gold prices have
placeholder
WTI steadies around $87.50 despite renewed supply concernsWest Texas Intermediate (WTI) oil price experiences volatility after registering over 2.5% losses in the previous day, trading around $87.40 per barrel during the Asian hours on Wednesday.
Author  FXStreet
18 hours ago
West Texas Intermediate (WTI) oil price experiences volatility after registering over 2.5% losses in the previous day, trading around $87.40 per barrel during the Asian hours on Wednesday.
placeholder
US May CPI Preview: Rising Inflation May Push Up Fed Rate Hike Expectations, How Will US Stocks, Dollar, Gold React? The U.S. Bureau of Labor Statistics will release May CPI data at 8:30 AM ET on June 10. This report is the most critical inflation reading ahead of the Federal Reserve's policy meeting on
Author  TradingKey
Yesterday 09: 55
The U.S. Bureau of Labor Statistics will release May CPI data at 8:30 AM ET on June 10. This report is the most critical inflation reading ahead of the Federal Reserve's policy meeting on
Related Instrument
goTop
quote