EUR/USD rebounds as Dollar weakens following Trump-Harris debate

Source Fxstreet
  • EUR/USD is rising as the US Dollar weakens following the Trump-Harris televised debate. 
  • The consensus was that Vice President Kamala Harris came out better after the debate. 
  • USD is falling because of the lower chance Trump will be able to implement Dollar-friendly policies. 

EUR/USD is exchanging hands in the 1.1040s, trading higher on Wednesday amid a broad-based weakening in the US Dollar (USD) following the Trump-Harris televised presidential election debate. 

Most analysts agree that Vice President Kamala Harris came out on top during the debate, and a recent poll from the BBC showed that she is ahead with 47% versus former President Donald Trump’s 43%. 

The US Dollar (USD) is weakening – and as a result EUR/USD is rising – because one of Trump’s policies is to protect the US Dollar’s status as the world’s reserve currency. This includes penalizing countries who refuse to trade in USD by imposing tariffs on their goods. The policy is a response to the growing influence of the BRICS trading bloc and its policy of de-dollarizing the global economy. 

EUR/USD rises as investors debate chance of jumbo Fed rate cut

EUR/USD is further strengthening as investors continue to see a sizable chance of the US Federal Reserve (Fed) cutting interest rates by a larger-than-standard 50 basis points (bps) at its next meeting on September 17-18. Whilst a 25 bps (0.25%) cut is already expected, the probabilities of a larger 50 bps “jumbo cut” currently stand at around 30% according to the CME FedWatch tool, which bases its predictions on the price of 30-day fed funds futures. A double-dose 50 bps cut would weigh on USD by reducing foreign capital inflows, but would be bullish for EUR/USD. 

US inflation data on tap

Wednesday sees the release of US Consumer Price Index (CPI) data for August, which would normally influence Fed rate-cut expectations. However, analysts vary in the extent to which they expect the data to have an impact – some say inflation has fallen so low now that it is irrelevant. 

“The (CPI) figure is no longer as overwhelmingly important as it was a few months ago,” says Ulricht Leutchmann, FX Analyst at Commerzbank. “The fight against inflation has seemingly been won. In the last three months, core consumer price inflation was a meager 1.6% (annualized) – well below levels that would be compatible with the Fed's target,” he adds. 

Elias Haddad, Senior Markets Strategist at Brown Brothers Harriman (BBH), however, says: “Higher than expected US inflation in August can reduce the probability of a jumbo Fed funds rate cut in September and underpin a firmer USD.” 

Deutsche Bank’s Jim Reid, meanwhile, makes the point that an important deflationary factor is the steep fall in crude Oil prices over recent days, with WTI crude Oil now trading in the mid $60s per barrel. “From the Fed’s perspective, one trend that’s helping to remove inflationary pressures has been the sharp decline in Oil prices over recent weeks,” he says in his “Early Morning Reid.”

ECB meeting in focus

EUR/USD upside is likely to be limited, however, by growth concerns in the Eurozone. Germany, in particular, is suffering from a much-publicized slowdown in manufacturing, especially in its key automobile sector, due to foreign competition. 

The European Central Bank (ECB) is scheduled to conclude its policy meeting on Thursday, and the consensus expectation is for the bank to announce a 25 bps cut to its deposit facility rate in order to help stimulate growth. The deposit facility rate (DFR) is the rate it pays banks on the money they deposit with the ECB. Such a cut would bring it down from 3.75% to 3.50%. 

Given the ECB has already announced plans to narrow the spread between the DFR and the main refinancing operations rate (MRO) from 50 bps to 15 bps (from September 18 onwards), the implication is that it will also slash the MRO – its headline rate – at Thursday’s meeting. Given the MRO currently sits at 4.25%, narrowing the spread with the DFR to only 15 bps would imply cutting the MRO by 0.60% to bring it down to 3.65%.  

Although the changes have already been telegraphed to the market, there is still a risk the Euro could weaken after the announcement. However, it is the updated macroeconomic projections that could provide the most volatility, with a risk the ECB could cut its growth forecasts. Such a move would weigh on EUR/USD. 

“Sluggish Eurozone economic activity suggests the risk is the ECB tweaks lower its inflation and real GDP growth forecasts. This can lead to a downward adjustment to Eurozone interest rate expectations against EUR,” says Elias Haddad, Senior Markets Strategist at Brown Brothers Harriman (BBH).    

Technical Analysis: EUR/USD continues posting lower lows

EUR/USD has broadly declined since peaking at 1.1202 on August 26. Despite a reaction higher between September 3-6, the pair has continued posting lower lows, most recently on Wednesday, when it fell to 1.1017. The pair is, therefore, probably in a downtrend and, since “the trend is your friend,” it could be argued the odds favor lower prices to come, although the downtrend is not strong. 

EUR/USD 4-hour Chart 

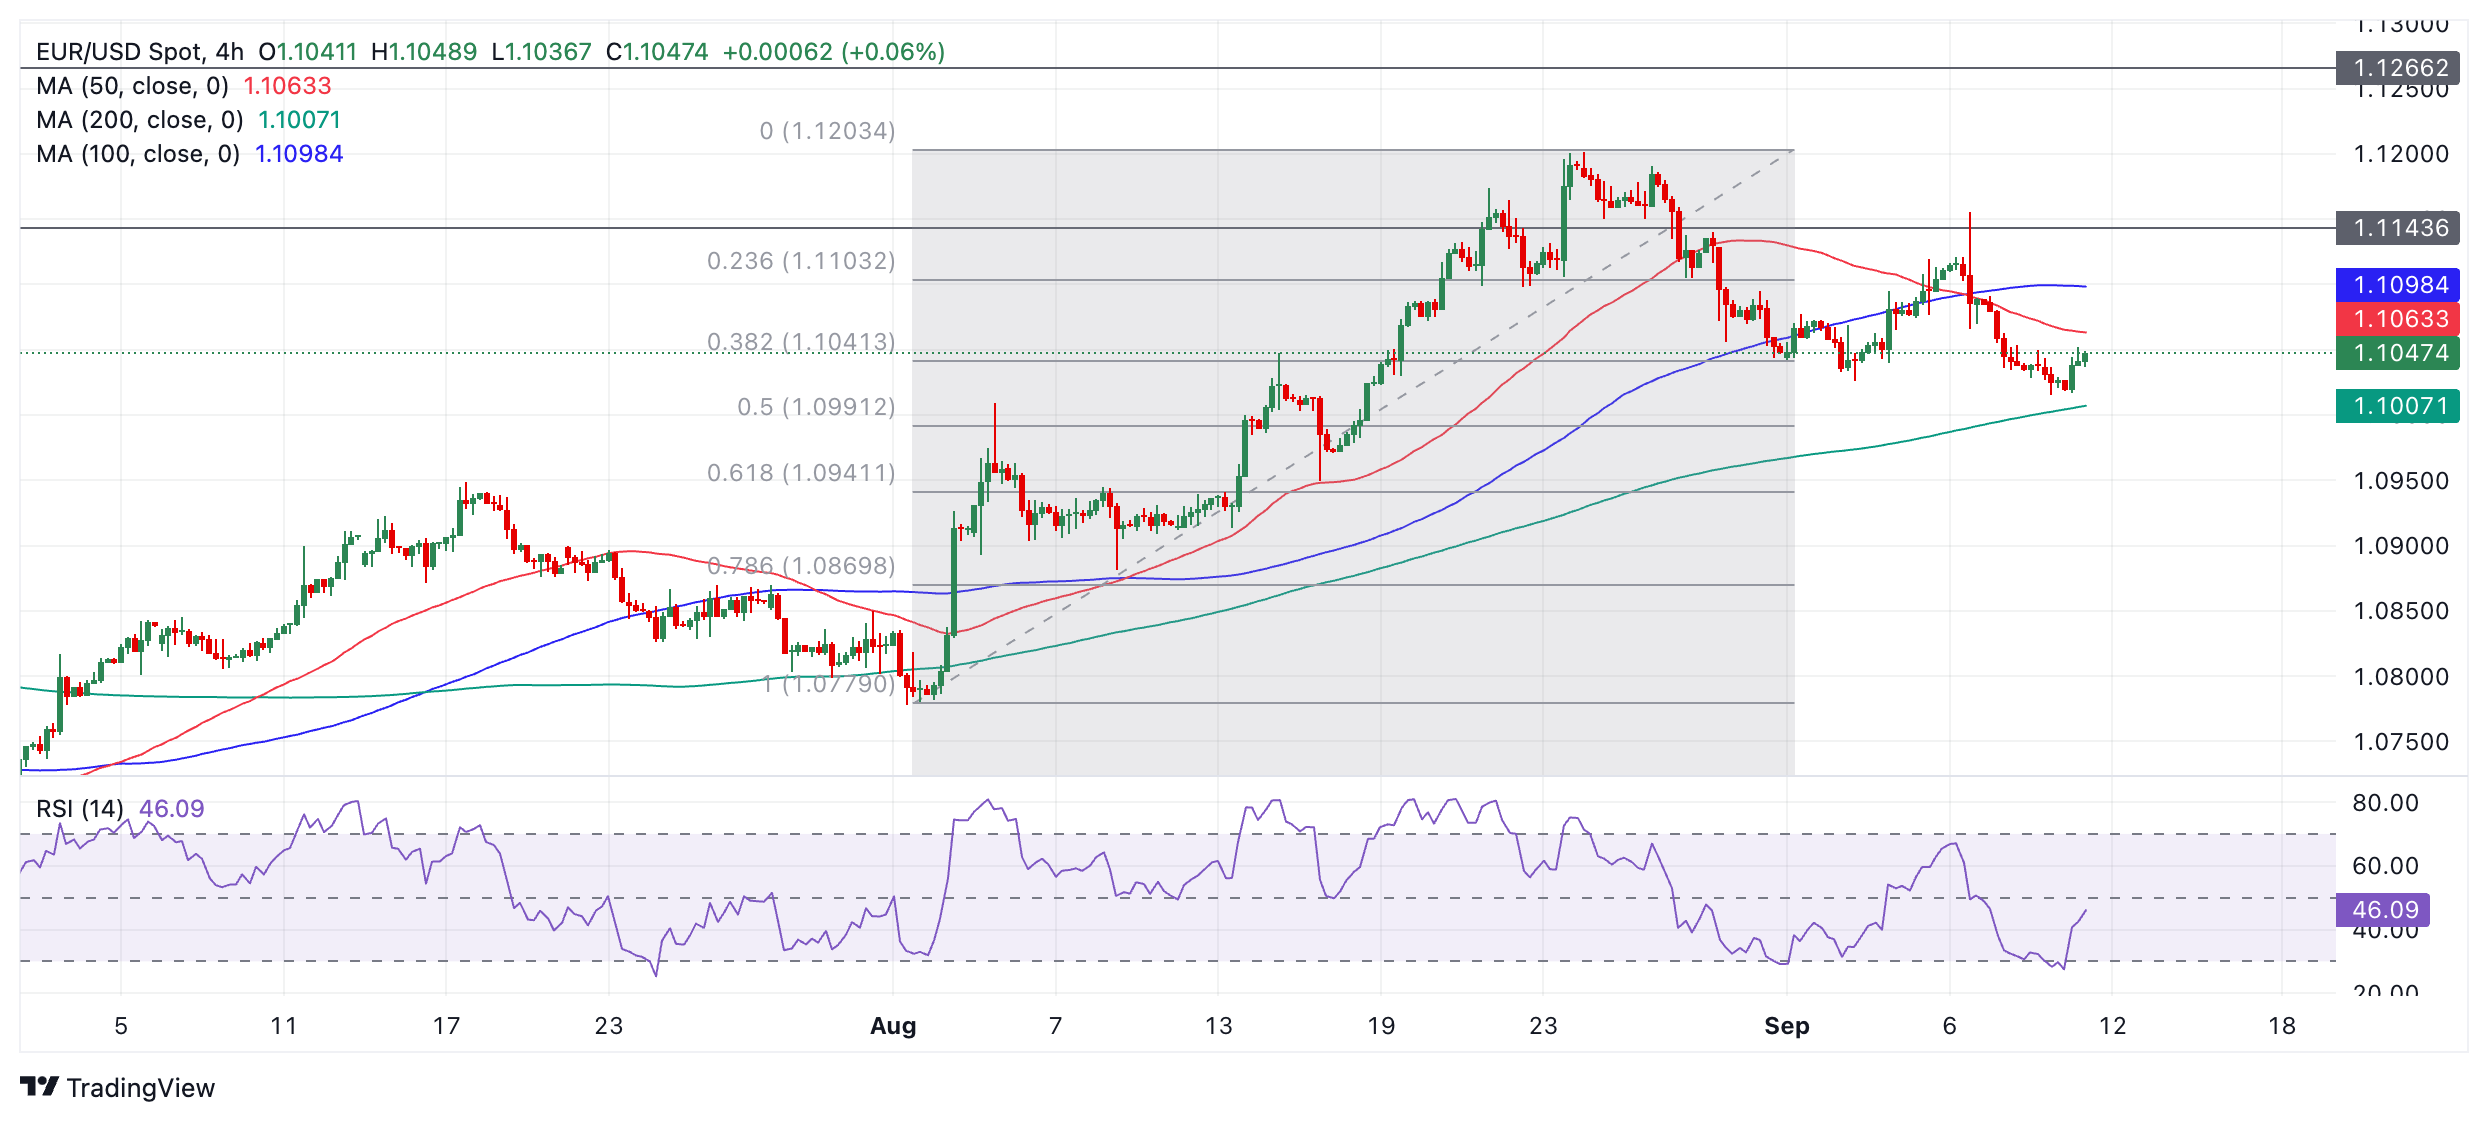
A break below 1.1017 would provide added confirmation of more downside, although it is now not far until the price reaches 1.1000 – a whole number and key psychological support level. 

Further weakness could see the pair fall to the Fibonacci 0.618 retracement of the August rally at 1.0941, where it would also likely find firm support. 

At the same time, risks of a recovery remain. The Relative Strength Index (RSI), for example, has risen sharply from the overbought zone, giving a buy signal, and it is still possible the pair could recover back up to the 1.1150 line of key resistance highs, if the counter-trend reaction currently underway persists.

Economic Indicator

Consumer Price Index (YoY)

Inflationary or deflationary tendencies are measured by periodically summing the prices of a basket of representative goods and services and presenting the data as The Consumer Price Index (CPI). CPI data is compiled on a monthly basis and released by the US Department of Labor Statistics. The YoY reading compares the prices of goods in the reference month to the same month a year earlier.The CPI is a key indicator to measure inflation and changes in purchasing trends. Generally speaking, a high reading is seen as bullish for the US Dollar (USD), while a low reading is seen as bearish.

Read more.

Next release: Wed Sep 11, 2024 12:30

Frequency: Monthly

Consensus: 2.6%

Previous: 2.9%

Source: US Bureau of Labor Statistics

The US Federal Reserve has a dual mandate of maintaining price stability and maximum employment. According to such mandate, inflation should be at around 2% YoY and has become the weakest pillar of the central bank’s directive ever since the world suffered a pandemic, which extends to these days. Price pressures keep rising amid supply-chain issues and bottlenecks, with the Consumer Price Index (CPI) hanging at multi-decade highs. The Fed has already taken measures to tame inflation and is expected to maintain an aggressive stance in the foreseeable future.


Disclaimer: For information purposes only. Past performance is not indicative of future results.
placeholder
Gold Price Forecast: XAU/USD drifts higher above $4,200 as Fed delivers expected cutGold price (XAU/USD) gains momentum to around $4,235 during the early Asian session on Thursday. The precious metal extends its upside after the US Federal Reserve (Fed) delivered an expected third consecutive interest rate cut and maintained its outlook for just one cut in 2026.
Author  FXStreet
Dec 11, Thu
Gold price (XAU/USD) gains momentum to around $4,235 during the early Asian session on Thursday. The precious metal extends its upside after the US Federal Reserve (Fed) delivered an expected third consecutive interest rate cut and maintained its outlook for just one cut in 2026.
placeholder
Gold remains bid as lack of Fed clarity and geopolitical frictions persistGold (XAU/USD) advances modestly on Friday as traders seem to book profits ahead of the weekend, yet clings to gains of over 0.51% after reaching a seven-week high of $4,353. At the time of writing, XAU/USD trades at $4,302 as traders digest comments from Federal Reserve (Fed) officials.
Author  FXStreet
Yesterday 01: 34
Gold (XAU/USD) advances modestly on Friday as traders seem to book profits ahead of the weekend, yet clings to gains of over 0.51% after reaching a seven-week high of $4,353. At the time of writing, XAU/USD trades at $4,302 as traders digest comments from Federal Reserve (Fed) officials.
placeholder
Ethereum Price Slips Lower — $3,000 Looms as the Key BattlegroundEthereum is attempting to recover from a $3,026 low but remains below $3,200 and the 100-hour SMA, with a bearish trend line near $3,175 capping rebounds as bulls need a clean break above $3,200 to target $3,250–$3,400, while a drop below $3,050 risks a retest of $3,000 and $2,940.
Author  Mitrade
Yesterday 03: 25
Ethereum is attempting to recover from a $3,026 low but remains below $3,200 and the 100-hour SMA, with a bearish trend line near $3,175 capping rebounds as bulls need a clean break above $3,200 to target $3,250–$3,400, while a drop below $3,050 risks a retest of $3,000 and $2,940.
placeholder
Macro Analysts: Hawkish Japan Could Push Bitcoin Below $70KAnalysts predict Bitcoin may face further declines towards the $70,000 mark if the Bank of Japan raises interest rates as expected.
Author  Mitrade
Yesterday 05: 48
Analysts predict Bitcoin may face further declines towards the $70,000 mark if the Bank of Japan raises interest rates as expected.
placeholder
Bitcoin Slides 5% as Sellers Lean In — Can BTC Reclaim $88,000?Bitcoin has dropped back below $88,000 after rolling over from $90,500, with price still trading under the 100-hour Simple Moving Average. The sell-off found a floor at $85,151, and BTC is now consolidating near that base, but rebounds are facing pressure from a bearish trend line around $89,000. Bulls need to retake $88,000–$89,000 to ease downside risk; failure to do so keeps $85,500–$85,000 and then $83,500 in play, with $80,000 as the deeper “line in the sand.” Bitcoin (BTC) is back in damage-control mode after a sharp pullback wiped out recent gains. The price failed to reclaim the $90,000–$90,500 band, rolled over, and slid through $88,500 before briefly dipping under $87,000. Buyers did show up around $85,000, but the rebound so far looks more like stabilization than a clear trend reversal. Bitcoin dips hard, finds a bid near $85,000(h3) BTC’s latest move lower began when it couldn’t build follow-through above $90,000 and $90,500. Once that upside stalled, sellers took control and pushed price down through $88,500. The slide accelerated enough to spike below $87,000, but the market didn’t free-fall. Bulls defended the $85,000 zone, printing a low at $85,151. Since then, Bitcoin has been consolidating below the 23.6% Fibonacci retracement of the drop from the $93,560 swing high to the $85,151 low — a clue that the bounce is still shallow and that sellers haven’t fully backed off yet. Structurally, BTC is still on the back foot: It’s trading below $88,000, and It remains below the 100-hour Simple Moving Average, keeping short-term trend pressure pointed downward. Resistance is layered, and $89,000 is the problem area(h3) If bulls try to turn this into a recovery, they’ll have to climb through multiple ceilings in quick succession. First, BTC faces resistance around $87,150, followed by a more meaningful barrier near $87,500. From there, the market’s attention snaps back to $88,000 — the level BTC just lost and now needs to reclaim. A close back above $88,000 would improve the tone, but it doesn’t solve the bigger issue: there’s a bearish trend line on the hourly BTC/USD chart (Kraken feed) with resistance near $89,000, which also lines up with the next technical hurdle. If BTC can push through $89,000 and hold, the rebound could extend toward $90,000, with follow-through targets at $91,000 and $91,500. But until price clears that $88,000–$89,000 zone, rallies are at risk of being sold rather than chased. If BTC fails to reclaim resistance, the downside path is clear(h3) The near-term bear case is simple: if Bitcoin can’t climb back above the $87,000 area and keep traction, sellers may attempt another leg lower. Support levels line up like this: Immediate support: $85,500 First major support: $85,000 Next support: $83,500 Then $82,500 in the near term Below that, the major “don’t break this” level is still $80,000. If BTC slips under $80,000, the risk of acceleration to the downside increases significantly — not because it’s magic, but because it’s the kind of psychological and structural level that tends to trigger forced de-risking. Indicators: momentum still leans bearish(h3) The intraday indicators aren’t offering much comfort yet: Hourly MACD is losing pace in the bearish zone. Hourly RSI remains below 50, suggesting sellers still have the upper hand on short timeframes. So while the $85,000 defense held for now, the market hasn’t flipped bullish — it’s just stopped bleeding.
Author  Mitrade
6 hours ago
Bitcoin has dropped back below $88,000 after rolling over from $90,500, with price still trading under the 100-hour Simple Moving Average. The sell-off found a floor at $85,151, and BTC is now consolidating near that base, but rebounds are facing pressure from a bearish trend line around $89,000. Bulls need to retake $88,000–$89,000 to ease downside risk; failure to do so keeps $85,500–$85,000 and then $83,500 in play, with $80,000 as the deeper “line in the sand.” Bitcoin (BTC) is back in damage-control mode after a sharp pullback wiped out recent gains. The price failed to reclaim the $90,000–$90,500 band, rolled over, and slid through $88,500 before briefly dipping under $87,000. Buyers did show up around $85,000, but the rebound so far looks more like stabilization than a clear trend reversal. Bitcoin dips hard, finds a bid near $85,000(h3) BTC’s latest move lower began when it couldn’t build follow-through above $90,000 and $90,500. Once that upside stalled, sellers took control and pushed price down through $88,500. The slide accelerated enough to spike below $87,000, but the market didn’t free-fall. Bulls defended the $85,000 zone, printing a low at $85,151. Since then, Bitcoin has been consolidating below the 23.6% Fibonacci retracement of the drop from the $93,560 swing high to the $85,151 low — a clue that the bounce is still shallow and that sellers haven’t fully backed off yet. Structurally, BTC is still on the back foot: It’s trading below $88,000, and It remains below the 100-hour Simple Moving Average, keeping short-term trend pressure pointed downward. Resistance is layered, and $89,000 is the problem area(h3) If bulls try to turn this into a recovery, they’ll have to climb through multiple ceilings in quick succession. First, BTC faces resistance around $87,150, followed by a more meaningful barrier near $87,500. From there, the market’s attention snaps back to $88,000 — the level BTC just lost and now needs to reclaim. A close back above $88,000 would improve the tone, but it doesn’t solve the bigger issue: there’s a bearish trend line on the hourly BTC/USD chart (Kraken feed) with resistance near $89,000, which also lines up with the next technical hurdle. If BTC can push through $89,000 and hold, the rebound could extend toward $90,000, with follow-through targets at $91,000 and $91,500. But until price clears that $88,000–$89,000 zone, rallies are at risk of being sold rather than chased. If BTC fails to reclaim resistance, the downside path is clear(h3) The near-term bear case is simple: if Bitcoin can’t climb back above the $87,000 area and keep traction, sellers may attempt another leg lower. Support levels line up like this: Immediate support: $85,500 First major support: $85,000 Next support: $83,500 Then $82,500 in the near term Below that, the major “don’t break this” level is still $80,000. If BTC slips under $80,000, the risk of acceleration to the downside increases significantly — not because it’s magic, but because it’s the kind of psychological and structural level that tends to trigger forced de-risking. Indicators: momentum still leans bearish(h3) The intraday indicators aren’t offering much comfort yet: Hourly MACD is losing pace in the bearish zone. Hourly RSI remains below 50, suggesting sellers still have the upper hand on short timeframes. So while the $85,000 defense held for now, the market hasn’t flipped bullish — it’s just stopped bleeding.
goTop
quote