Mexican Peso edges lower on rumors of dissenting senator

Source Fxstreet
  • The Mexican Peso is edging lower amid investor concerns the government will pass through a controversial judicial reform bill. 
  • Rumors an opposition senator has crossed the floor and will vote with the government are weighing. 
  • USD/MXN continues rising in a bullish channel. 

The Mexican Peso (MXN) trades marginally lower on Tuesday, maintaining the steady bear trend established in its key pairs since April. The Peso is weakening amid investor concerns the government will successfully vote through a controversial judicial reform bill in the country’s upper house, the Senate. 

MXN is also facing pressure following the release of lower inflation data for August, which increases the chances the Bank of Mexico (Banxico) will cut interest rates at its next meeting. This would be negative for the Peso as lower interest rates reduce foreign capital inflows.

On the upside, the Peso could be finding support from long-term geopolitical shifts amid deeper global trade fragmentation, after former President Donald Trump threatened to impose tariffs on countries who refuse to trade in the US Dollar (USD) if he is elected as President. Such a move, however, could place Mexico in a strong position as an intermediary.  

Over recent days, Trump has recovered after lagging in opinion polls ahead of a key televised presidential debate with rival US Vice President Kamala Harris, scheduled for Tuesday. 

Mexican Peso faces heat on rumors opposition senator could dissent

The Mexican Peso is under pressure as the Mexican government gets closer to voting through a bill of reforms to the judiciary that will allow judges to be elected rather than appointed. Most investors view these reforms as potentially negative for inbound investment and the economy. 

The bill is now being debated in the Senate, where the government is one seat short of the majority necessary to vote it through. However, rumors that a member of the (PAN) opposition party, Miguel Angel Yunes, is considering crossing the floor to vote alongside the government suggest there is a good chance the reforms will pass, according to El Financiero. Lawmakers will vote on the bill either on Tuesday or Wednesday. The result is likely to impact the Mexican Peso. 

Several big-name investors have come out against the reforms, including US investment banking giant Morgan Stanley. More recently, Julius Baer warned that rating agencies could change Mexico’s creditworthiness as soon as next year if the judicial reform is approved. Erini Tsekeridou, a fixed-income analyst, said, “although the economic impact is not yet fully clear, markets are concerned about the potential weakening of the rule of law and the concentration of judicial and executive power, which would reduce oversight and accountability,” according to Christian Borjon Valencia, Analyst at FXStreet.

“Julius Baer added their name to Morgan Stanley, Bank of America, JP Morgan, Citibanamex and Fitch ratings warnings of the economic and financial impact regarding the approval of judicial reform,” added Borjon Valencia in his report. 

August Mexican inflation data shows price gains cooling more than expected 

The Mexican Peso is further weighed after data out on Monday showed 12-month headline inflation in Mexico fell to 4.99% in August from 5.57% in July, according to INEGI. The result was below economists' forecasts of 5.09%.

Core Inflation, meanwhile, fell to 4.00% from 4.05% over the same period. 

The data reinforces expectations that Banxico will cut interest rates by 0.25% at its next meeting, bringing the official bank rate down to 10.50%. 

“The larger-than-expected fall in Mexico’s headline inflation rate, to 5.0% y/y in August, alongside the likelihood of a Fed rate cut next week, mean that Banxico is on track to lower its policy rate by another 25bp at its meeting later this month,” said Kimberley Sperrfechter, Emerging Markets Economist at Capital Economics. 

At the time of writing, one US Dollar (USD) buys 19.90 Mexican Pesos, EUR/MXN trades at 21.97, and GBP/MXN at 26.06.


Technical Analysis: USD/MXN rising in a bullish channel 

USD/MXN is trading within the bounds of a gently ascending mini-channel, which itself lies within a broader rising channel that began in April. 

USD/MXN Daily Chart 

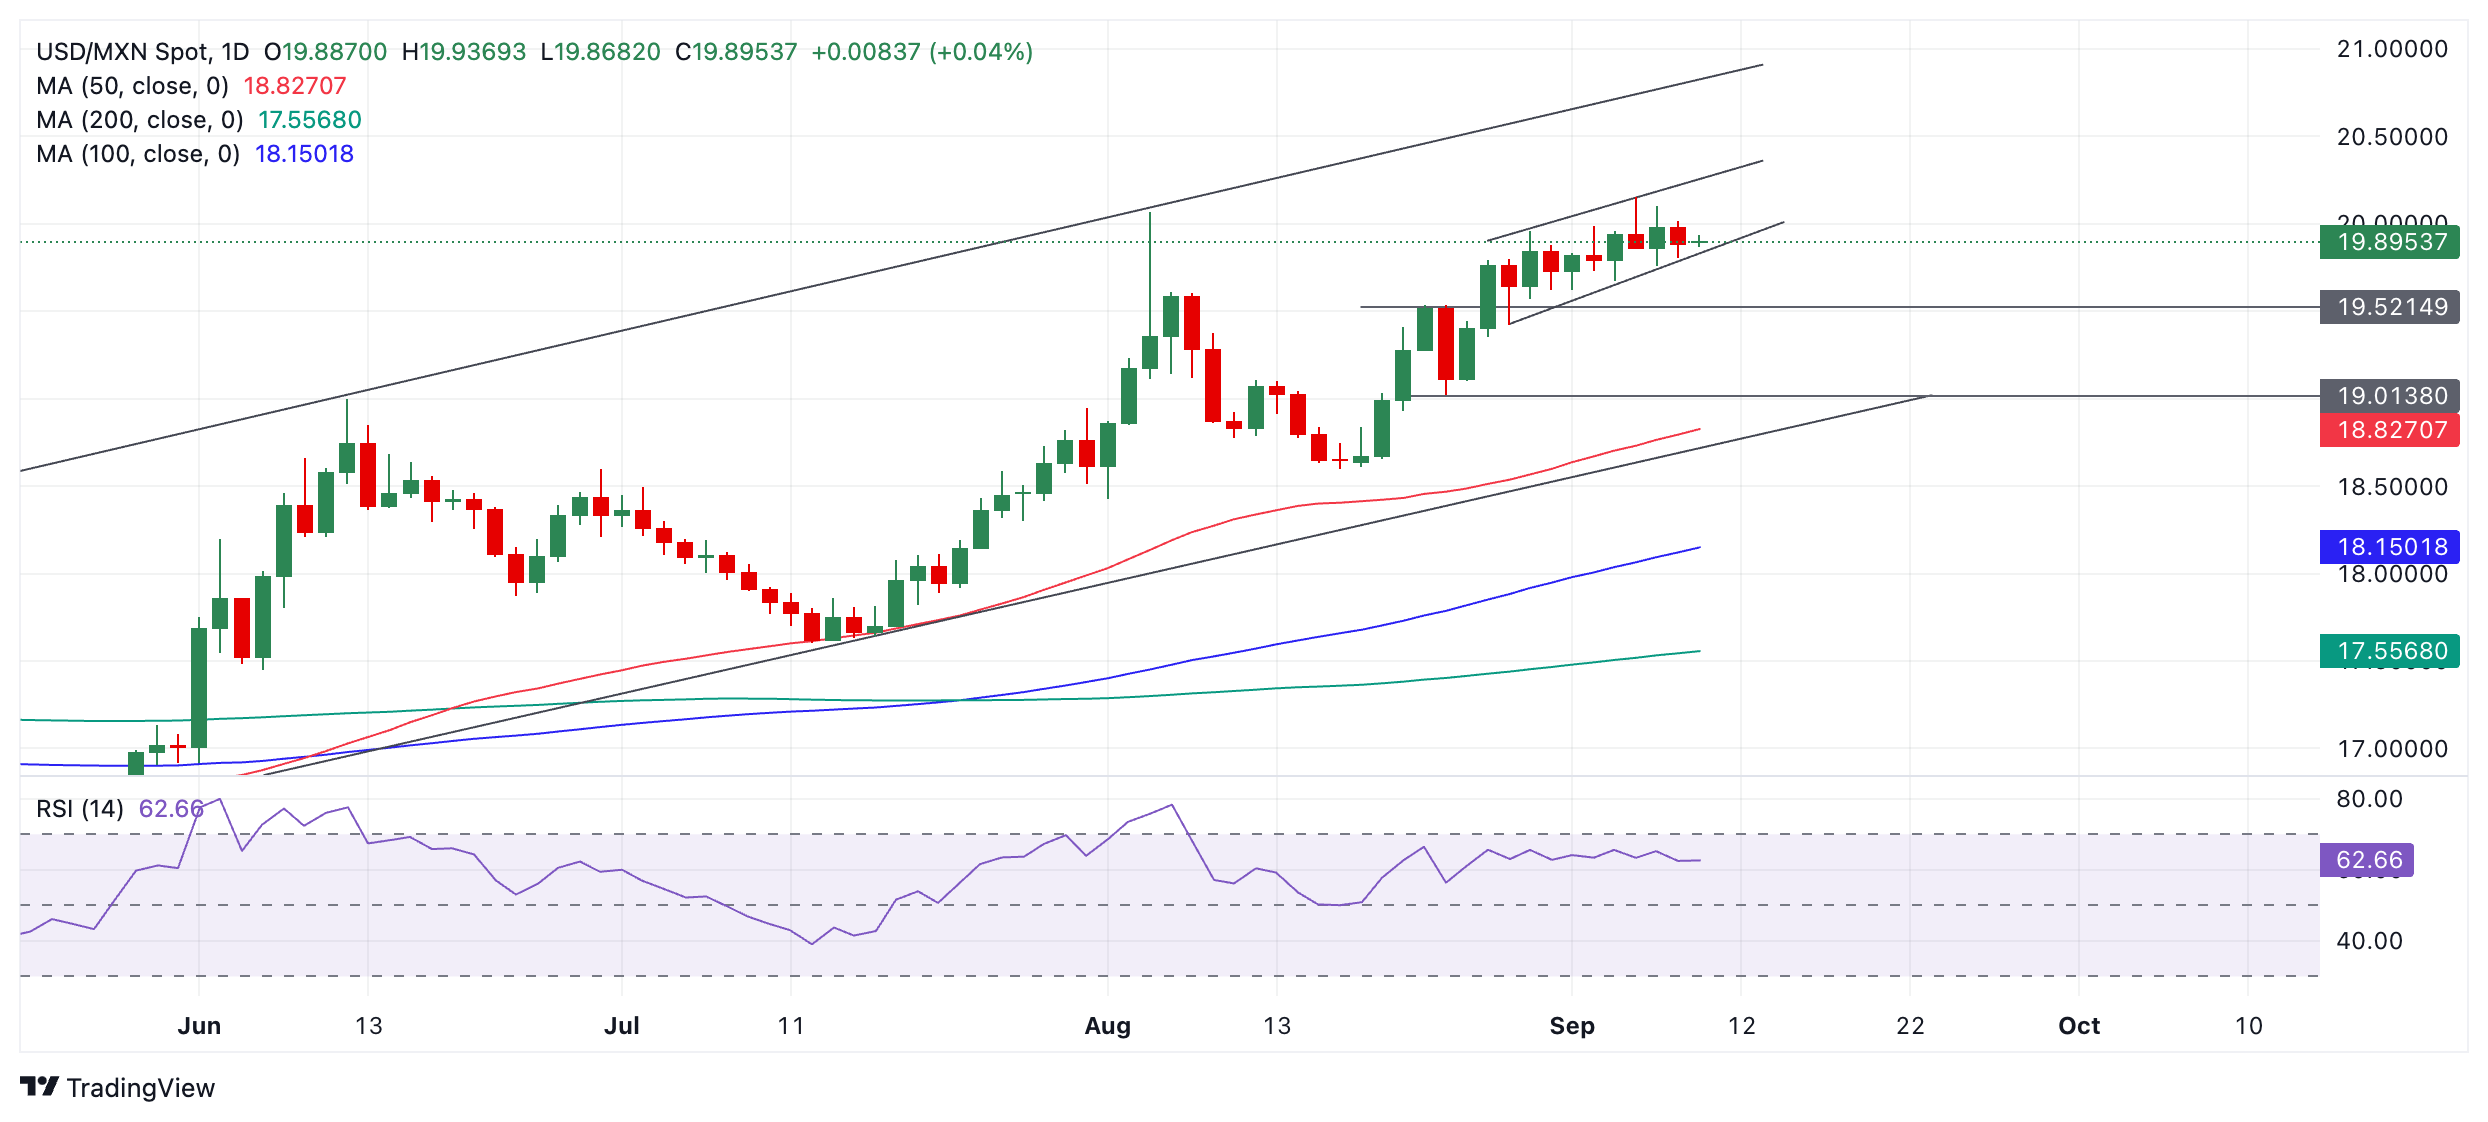
The overall trend is bullish, and since, according to technical analysis theory, “the trend is your friend,” this favors more upside. As such, any weakness may be temporary before the pair rallies again.

A break above the top of the mini-channel and year-to-date high at 20.15 would provide added confirmation of a continuation of the bull trend, with the next target at the upper channel line in the 20.60s.  

It would require a decisive breakout below the mini-channel lows to bring into doubt the short-term uptrend bias.

Economic Indicator

12-Month Inflation

The 12-month inflation index released by the Bank of Mexico is a measure of price movements by the comparison between the retail prices of a representative shopping basket of goods and services. The purchase power of Mexican Peso is dragged down by inflation. The inflation index is a key indicator since it is used by the central bank to set interest rates. Generally speaking, a high reading is seen as positive (or bullish) for the Mexican Peso, while a low reading is seen as negative (or Bearish).

Read more.

Last release: Mon Sep 09, 2024 12:00

Frequency: Monthly

Actual: 4.99%

Consensus: 5.09%

Previous: 5.57%

Source: National Institute of Statistics and Geography of Mexico


Disclaimer: For information purposes only. Past performance is not indicative of future results.
placeholder
Gold Price Forecast: XAU/USD drifts higher above $4,200 as Fed delivers expected cutGold price (XAU/USD) gains momentum to around $4,235 during the early Asian session on Thursday. The precious metal extends its upside after the US Federal Reserve (Fed) delivered an expected third consecutive interest rate cut and maintained its outlook for just one cut in 2026.
Author  FXStreet
Dec 11, Thu
Gold price (XAU/USD) gains momentum to around $4,235 during the early Asian session on Thursday. The precious metal extends its upside after the US Federal Reserve (Fed) delivered an expected third consecutive interest rate cut and maintained its outlook for just one cut in 2026.
placeholder
Gold remains bid as lack of Fed clarity and geopolitical frictions persistGold (XAU/USD) advances modestly on Friday as traders seem to book profits ahead of the weekend, yet clings to gains of over 0.51% after reaching a seven-week high of $4,353. At the time of writing, XAU/USD trades at $4,302 as traders digest comments from Federal Reserve (Fed) officials.
Author  FXStreet
Yesterday 01: 34
Gold (XAU/USD) advances modestly on Friday as traders seem to book profits ahead of the weekend, yet clings to gains of over 0.51% after reaching a seven-week high of $4,353. At the time of writing, XAU/USD trades at $4,302 as traders digest comments from Federal Reserve (Fed) officials.
placeholder
Ethereum Price Slips Lower — $3,000 Looms as the Key BattlegroundEthereum is attempting to recover from a $3,026 low but remains below $3,200 and the 100-hour SMA, with a bearish trend line near $3,175 capping rebounds as bulls need a clean break above $3,200 to target $3,250–$3,400, while a drop below $3,050 risks a retest of $3,000 and $2,940.
Author  Mitrade
Yesterday 03: 25
Ethereum is attempting to recover from a $3,026 low but remains below $3,200 and the 100-hour SMA, with a bearish trend line near $3,175 capping rebounds as bulls need a clean break above $3,200 to target $3,250–$3,400, while a drop below $3,050 risks a retest of $3,000 and $2,940.
placeholder
Macro Analysts: Hawkish Japan Could Push Bitcoin Below $70KAnalysts predict Bitcoin may face further declines towards the $70,000 mark if the Bank of Japan raises interest rates as expected.
Author  Mitrade
Yesterday 05: 48
Analysts predict Bitcoin may face further declines towards the $70,000 mark if the Bank of Japan raises interest rates as expected.
placeholder
Bitcoin Slides 5% as Sellers Lean In — Can BTC Reclaim $88,000?Bitcoin has dropped back below $88,000 after rolling over from $90,500, with price still trading under the 100-hour Simple Moving Average. The sell-off found a floor at $85,151, and BTC is now consolidating near that base, but rebounds are facing pressure from a bearish trend line around $89,000. Bulls need to retake $88,000–$89,000 to ease downside risk; failure to do so keeps $85,500–$85,000 and then $83,500 in play, with $80,000 as the deeper “line in the sand.” Bitcoin (BTC) is back in damage-control mode after a sharp pullback wiped out recent gains. The price failed to reclaim the $90,000–$90,500 band, rolled over, and slid through $88,500 before briefly dipping under $87,000. Buyers did show up around $85,000, but the rebound so far looks more like stabilization than a clear trend reversal. Bitcoin dips hard, finds a bid near $85,000(h3) BTC’s latest move lower began when it couldn’t build follow-through above $90,000 and $90,500. Once that upside stalled, sellers took control and pushed price down through $88,500. The slide accelerated enough to spike below $87,000, but the market didn’t free-fall. Bulls defended the $85,000 zone, printing a low at $85,151. Since then, Bitcoin has been consolidating below the 23.6% Fibonacci retracement of the drop from the $93,560 swing high to the $85,151 low — a clue that the bounce is still shallow and that sellers haven’t fully backed off yet. Structurally, BTC is still on the back foot: It’s trading below $88,000, and It remains below the 100-hour Simple Moving Average, keeping short-term trend pressure pointed downward. Resistance is layered, and $89,000 is the problem area(h3) If bulls try to turn this into a recovery, they’ll have to climb through multiple ceilings in quick succession. First, BTC faces resistance around $87,150, followed by a more meaningful barrier near $87,500. From there, the market’s attention snaps back to $88,000 — the level BTC just lost and now needs to reclaim. A close back above $88,000 would improve the tone, but it doesn’t solve the bigger issue: there’s a bearish trend line on the hourly BTC/USD chart (Kraken feed) with resistance near $89,000, which also lines up with the next technical hurdle. If BTC can push through $89,000 and hold, the rebound could extend toward $90,000, with follow-through targets at $91,000 and $91,500. But until price clears that $88,000–$89,000 zone, rallies are at risk of being sold rather than chased. If BTC fails to reclaim resistance, the downside path is clear(h3) The near-term bear case is simple: if Bitcoin can’t climb back above the $87,000 area and keep traction, sellers may attempt another leg lower. Support levels line up like this: Immediate support: $85,500 First major support: $85,000 Next support: $83,500 Then $82,500 in the near term Below that, the major “don’t break this” level is still $80,000. If BTC slips under $80,000, the risk of acceleration to the downside increases significantly — not because it’s magic, but because it’s the kind of psychological and structural level that tends to trigger forced de-risking. Indicators: momentum still leans bearish(h3) The intraday indicators aren’t offering much comfort yet: Hourly MACD is losing pace in the bearish zone. Hourly RSI remains below 50, suggesting sellers still have the upper hand on short timeframes. So while the $85,000 defense held for now, the market hasn’t flipped bullish — it’s just stopped bleeding.
Author  Mitrade
10 hours ago
Bitcoin has dropped back below $88,000 after rolling over from $90,500, with price still trading under the 100-hour Simple Moving Average. The sell-off found a floor at $85,151, and BTC is now consolidating near that base, but rebounds are facing pressure from a bearish trend line around $89,000. Bulls need to retake $88,000–$89,000 to ease downside risk; failure to do so keeps $85,500–$85,000 and then $83,500 in play, with $80,000 as the deeper “line in the sand.” Bitcoin (BTC) is back in damage-control mode after a sharp pullback wiped out recent gains. The price failed to reclaim the $90,000–$90,500 band, rolled over, and slid through $88,500 before briefly dipping under $87,000. Buyers did show up around $85,000, but the rebound so far looks more like stabilization than a clear trend reversal. Bitcoin dips hard, finds a bid near $85,000(h3) BTC’s latest move lower began when it couldn’t build follow-through above $90,000 and $90,500. Once that upside stalled, sellers took control and pushed price down through $88,500. The slide accelerated enough to spike below $87,000, but the market didn’t free-fall. Bulls defended the $85,000 zone, printing a low at $85,151. Since then, Bitcoin has been consolidating below the 23.6% Fibonacci retracement of the drop from the $93,560 swing high to the $85,151 low — a clue that the bounce is still shallow and that sellers haven’t fully backed off yet. Structurally, BTC is still on the back foot: It’s trading below $88,000, and It remains below the 100-hour Simple Moving Average, keeping short-term trend pressure pointed downward. Resistance is layered, and $89,000 is the problem area(h3) If bulls try to turn this into a recovery, they’ll have to climb through multiple ceilings in quick succession. First, BTC faces resistance around $87,150, followed by a more meaningful barrier near $87,500. From there, the market’s attention snaps back to $88,000 — the level BTC just lost and now needs to reclaim. A close back above $88,000 would improve the tone, but it doesn’t solve the bigger issue: there’s a bearish trend line on the hourly BTC/USD chart (Kraken feed) with resistance near $89,000, which also lines up with the next technical hurdle. If BTC can push through $89,000 and hold, the rebound could extend toward $90,000, with follow-through targets at $91,000 and $91,500. But until price clears that $88,000–$89,000 zone, rallies are at risk of being sold rather than chased. If BTC fails to reclaim resistance, the downside path is clear(h3) The near-term bear case is simple: if Bitcoin can’t climb back above the $87,000 area and keep traction, sellers may attempt another leg lower. Support levels line up like this: Immediate support: $85,500 First major support: $85,000 Next support: $83,500 Then $82,500 in the near term Below that, the major “don’t break this” level is still $80,000. If BTC slips under $80,000, the risk of acceleration to the downside increases significantly — not because it’s magic, but because it’s the kind of psychological and structural level that tends to trigger forced de-risking. Indicators: momentum still leans bearish(h3) The intraday indicators aren’t offering much comfort yet: Hourly MACD is losing pace in the bearish zone. Hourly RSI remains below 50, suggesting sellers still have the upper hand on short timeframes. So while the $85,000 defense held for now, the market hasn’t flipped bullish — it’s just stopped bleeding.
goTop
quote