


USD/INR remains stable due to rising likelihood of RBI intervention
- The Indian Rupee maintains its position as traders expect RBI to intervene to support the domestic currency.
- The USD/INR pair could appreciate if Asian markets experience a decline due to rising concerns about the US economy.
- The US Dollar receives support due to rising doubts on the scale of the Fed rate cut in September.
The Indian Rupee (INR) holds steady against the US Dollar (USD) on Tuesday, with traders speculating that the Reserve Bank of India (RBI) likely intervened in the foreign exchange market to support the domestic currency and prevent it from weakening beyond the 84.00 level.
The USD/INR pair could appreciate in the near term as a broader decline in Asian equities and currencies emerges, fueled by rising concerns about a potential slowdown in the US economy. However, lower Oil prices may help ease downward pressure on the INR, as India, being the world's third-largest oil consumer and importer, stands to benefit from reduced import costs.
The US Dollar appreciates due to the reduced likelihood of an aggressive interest rate cut by the Federal Reserve (Fed) at its September meeting. According to the CME FedWatch Tool, the likelihood of a 50 bps rate cut has slightly decreased to 29.0%, down from 30.0% a week ago.
Daily Digest Market Movers: Indian Rupee holds ground due to potential RBI intervention
- Chicago Fed President Austan Goolsbee remarked on Friday that Fed officials are starting to align with the broader market's sentiment that a policy rate adjustment by the US central bank is imminent, according to CNBC. FXStreet’s FedTracker, which uses a custom AI model to evaluate Fed officials' speeches on a dovish-to-hawkish scale from 0 to 10, rated Goolsbee's comments as dovish, assigning them a score of 3.2.
- India's FX Reserves reached a record high of $683.99 billion as of August 30, up from $681.69 billion previously. This surge is largely due to a substantial influx of foreign exchange into the Indian economy, spurred by robust economic growth and the long-anticipated inclusion of Indian assets in JPMorgan's major emerging market debt index, which has enhanced foreign investment.
- ADP Employment Change showed on Thursday that private-sector employment increased by 99,000 in August, following July’s increase of 111,000 and below the estimate of 145,000. Meanwhile, the weekly US Initial Jobless Claims rose to 227,000 for the week ending August 30, compared to the previous reading of 232,000 and below the initial consensus of 230,000.
- “The Composite PMI for India continued to show strong growth in August, driven by accelerated business activity in the service sector, which experienced its fastest expansion since March. This growth was largely fuelled by an increase in new orders, particularly domestic orders,” said Pranjul Bhandari, Chief India Economist at HSBC.
- The World Bank has raised India's growth forecast to 7% for the current financial year (FY25), up from an earlier projection of 6.6%.
Technical Analysis: USD/INR stays below 84.00, testing support at nine-day EMA
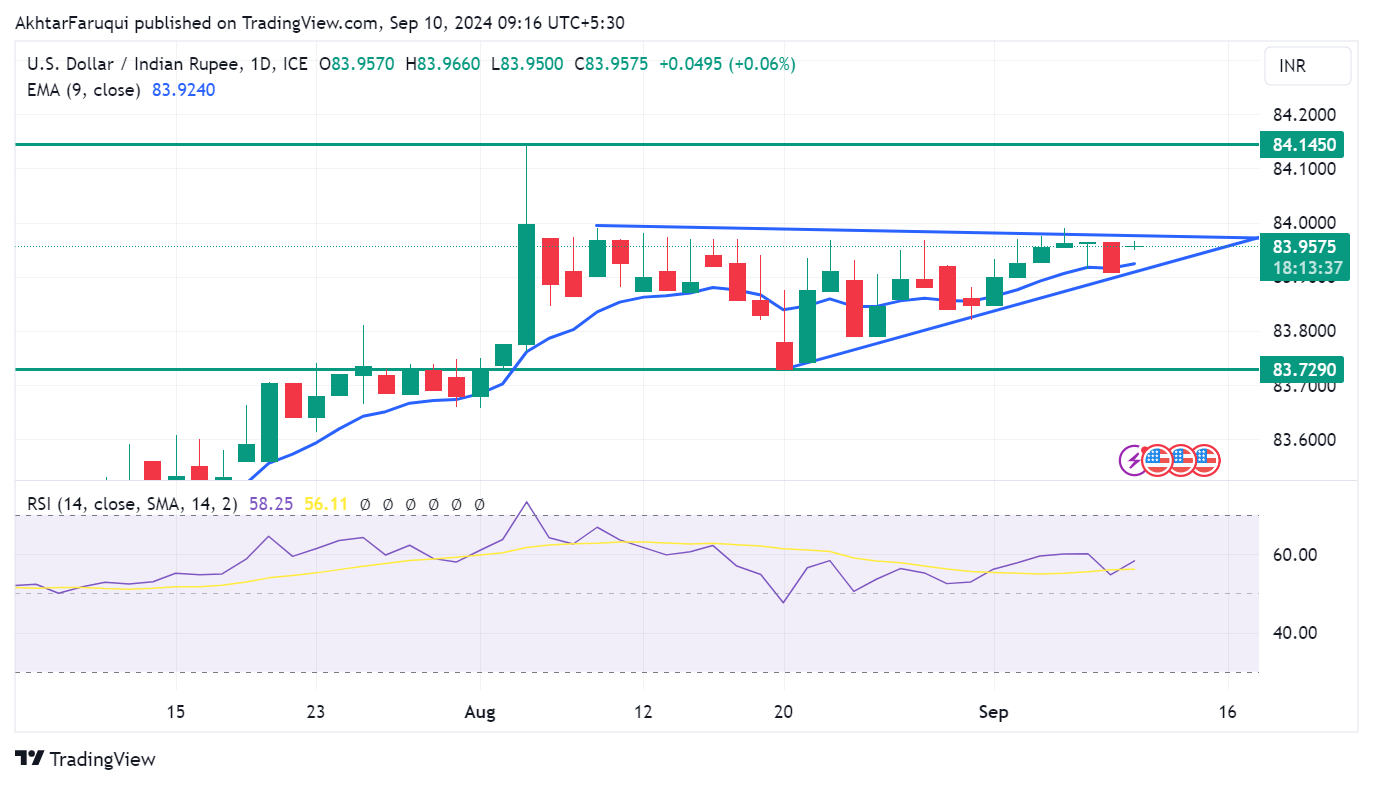
The Indian Rupee trades around 84.00 on Tuesday. A review of the daily chart shows that the USD/INR pair is consolidating within a symmetrical triangle pattern, signaling reduced volatility and a phase of consolidation. Despite this, the 14-day Relative Strength Index (RSI) remains above 50, indicating the bullish trend is still intact.
On the downside, the nine-day Exponential Moving Average (EMA) at 83.91 serves as immediate support, aligned with the lower boundary of the symmetrical triangle near 83.90. A break below this level could trigger a bearish shift, putting downward pressure on the USD/INR pair and potentially pushing it toward its six-week low around 83.72.
On the resistance side, the USD/INR pair is testing the upper boundary of the symmetrical triangle near the 84.00 level. A breakout above this point could drive the pair toward the all-time high of 84.14, recorded on August 5.
USD/INR: Daily Chart
Indian Rupee FAQs
The Indian Rupee (INR) is one of the most sensitive currencies to external factors. The price of Crude Oil (the country is highly dependent on imported Oil), the value of the US Dollar – most trade is conducted in USD – and the level of foreign investment, are all influential. Direct intervention by the Reserve Bank of India (RBI) in FX markets to keep the exchange rate stable, as well as the level of interest rates set by the RBI, are further major influencing factors on the Rupee.
The Reserve Bank of India (RBI) actively intervenes in forex markets to maintain a stable exchange rate, to help facilitate trade. In addition, the RBI tries to maintain the inflation rate at its 4% target by adjusting interest rates. Higher interest rates usually strengthen the Rupee. This is due to the role of the ‘carry trade’ in which investors borrow in countries with lower interest rates so as to place their money in countries’ offering relatively higher interest rates and profit from the difference.
Macroeconomic factors that influence the value of the Rupee include inflation, interest rates, the economic growth rate (GDP), the balance of trade, and inflows from foreign investment. A higher growth rate can lead to more overseas investment, pushing up demand for the Rupee. A less negative balance of trade will eventually lead to a stronger Rupee. Higher interest rates, especially real rates (interest rates less inflation) are also positive for the Rupee. A risk-on environment can lead to greater inflows of Foreign Direct and Indirect Investment (FDI and FII), which also benefit the Rupee.
Higher inflation, particularly, if it is comparatively higher than India’s peers, is generally negative for the currency as it reflects devaluation through oversupply. Inflation also increases the cost of exports, leading to more Rupees being sold to purchase foreign imports, which is Rupee-negative. At the same time, higher inflation usually leads to the Reserve Bank of India (RBI) raising interest rates and this can be positive for the Rupee, due to increased demand from international investors. The opposite effect is true of lower inflation.
Recommended Articles


