USD/CAD Price Prediction: Breaks above key trendline after strong Canadian GDP data

Source Fxstreet
  • USD/CAD has broken above a key trendline and probably reversed trend. 
  • There is a possibility it could start trending higher if the break holds and prices move above 1.3520-25. 

USD/CAD is decisively breaking above a key trendline for the downtrend it has been in since the start of August. 

The break comes after the release of higher-than-expected Canadian GDP data strengthened the Canadian Dollar (CAD). It probably means the short-term downtrend is reversing, although more upside is required for confirmation. 

USD/CAD 4-hour Chart
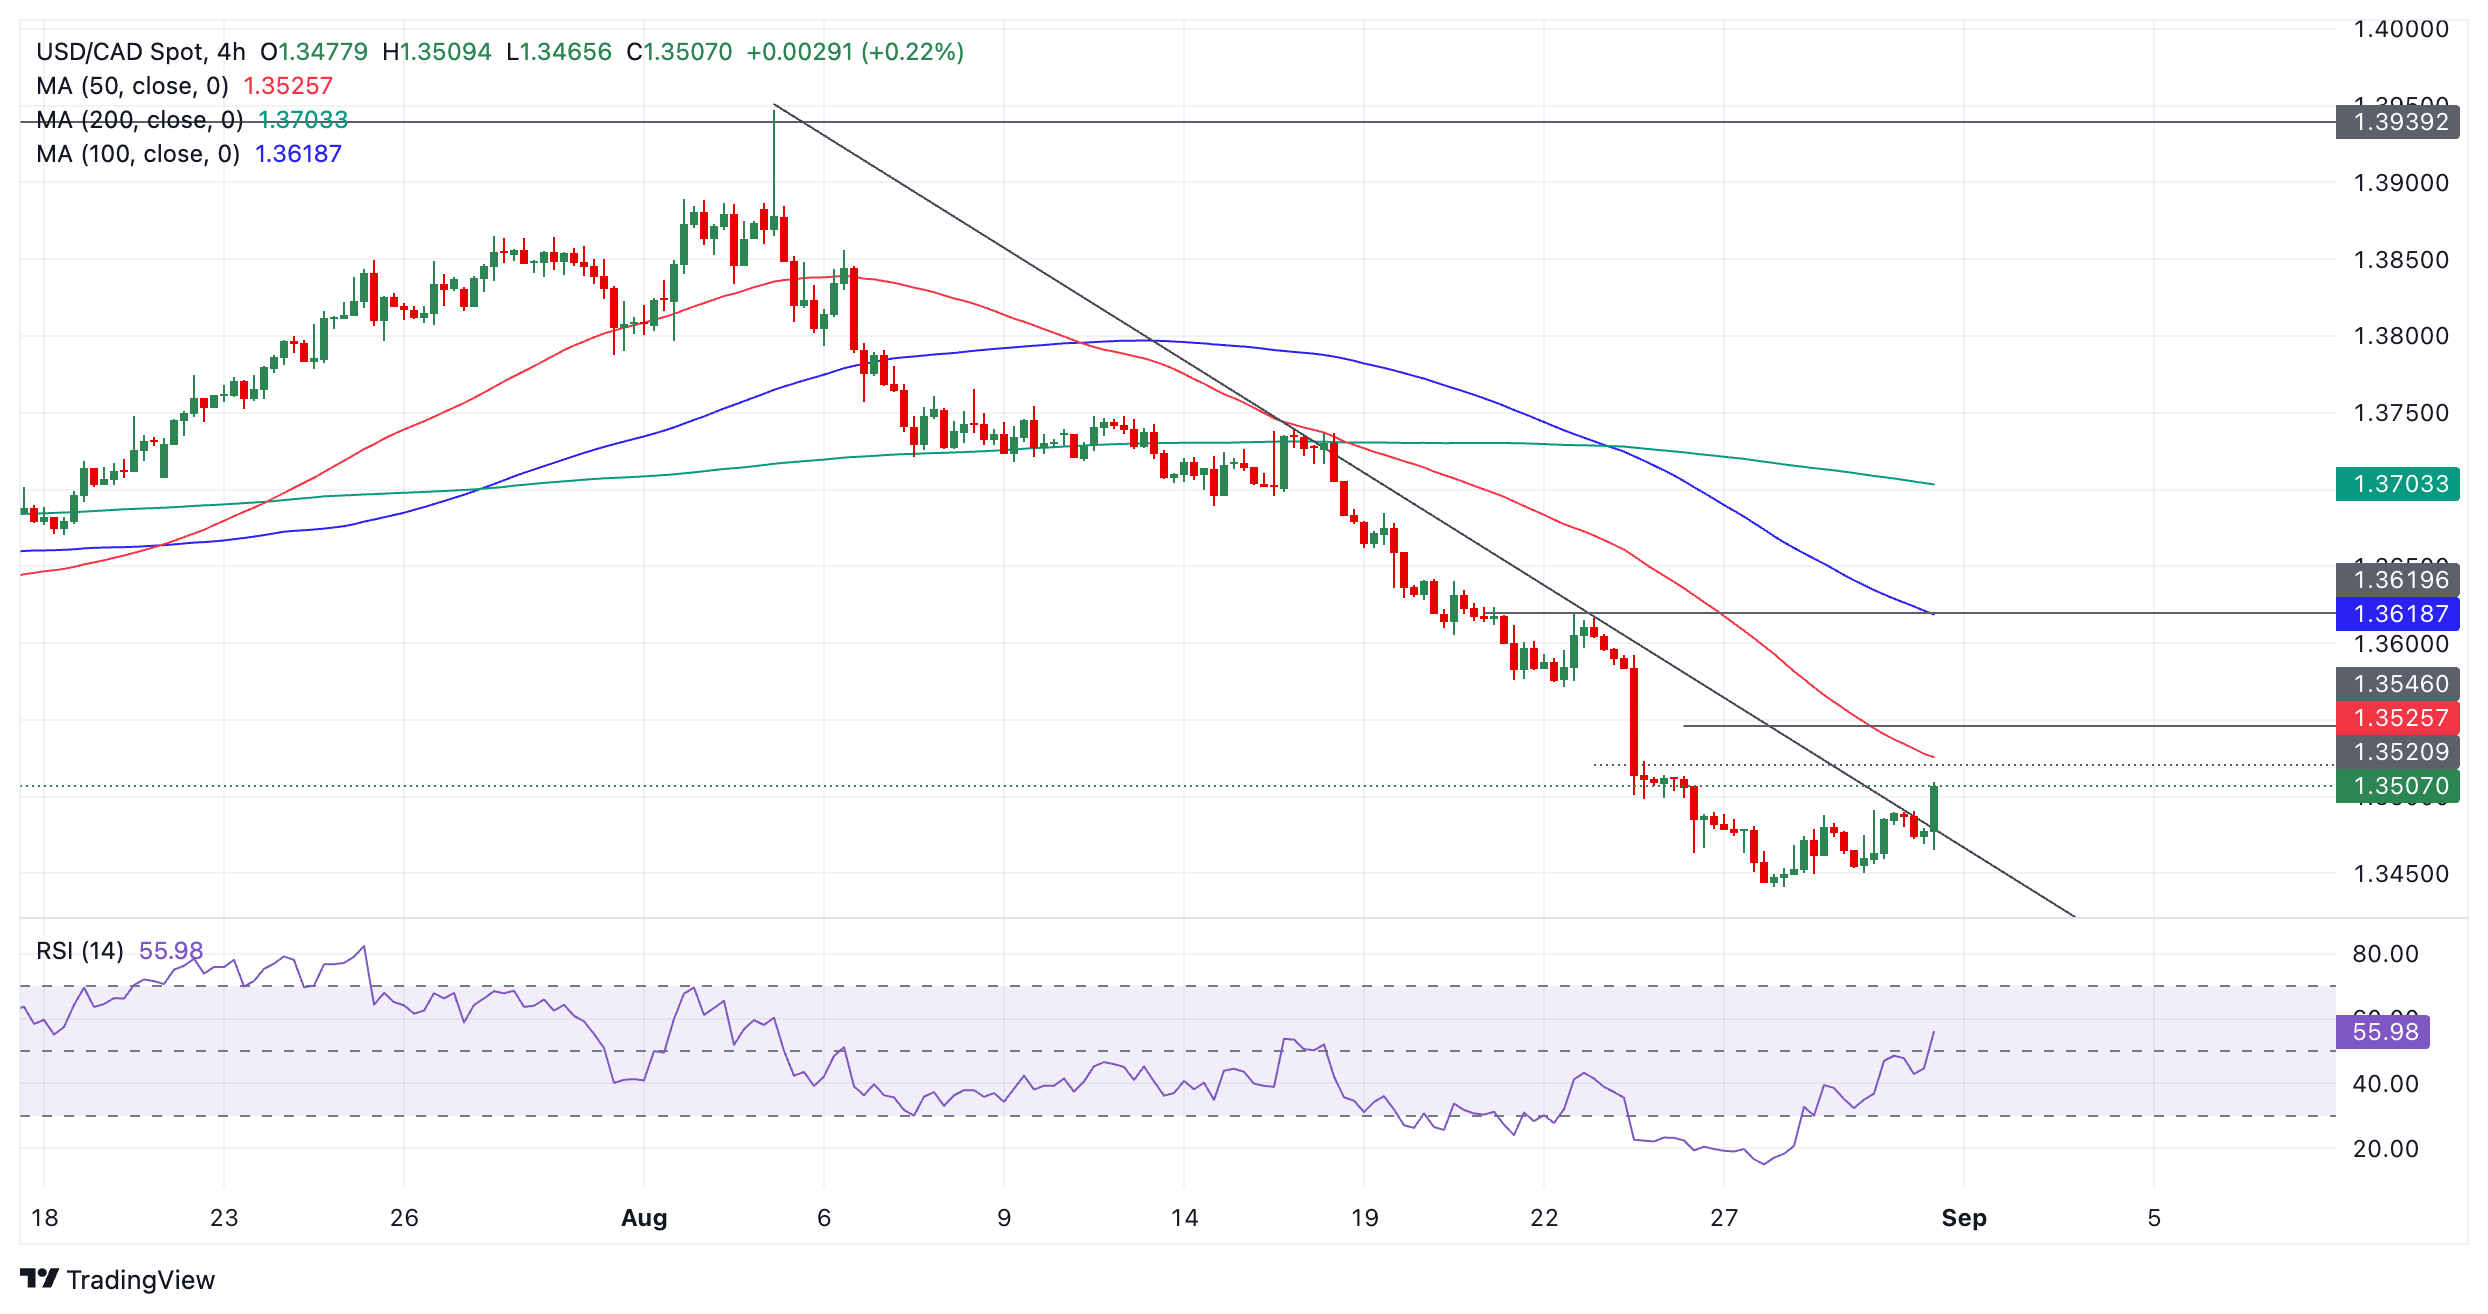
The trendline break was  accompanied by a rise in the Relative Strength Index (RSI) momentum indicator out of its oversold zone, which provides a buy signal. This indicates either an extended correction higher is likely, or a complete reversal of the hitherto bear trend. 

A close above 1.3520-25 and the trendline would bring into doubt the bearish bias and could indicate early signs of a reversal. Such a break could see the pair move up to 1.3593. A move above the latter would give a surer sign of a reversal of the trend.  

If the break fails to hold and prices pull back down and close below the trend line, the bear trend might extend lower. The next bearish target is situated at 1.3380 – the swing lows of October 2023 and January 2024. This is followed by the bottom of the range at 1.3222. 


Disclaimer: For information purposes only. Past performance is not indicative of future results.
placeholder
Bitcoin Outlook 2025As the Bitcoin market continues to mature, its 2025 outlook appears highly favourable, driven by institutional adoption and regulatory developments.
Author  TradingKey
Jan 23, Thu
As the Bitcoin market continues to mature, its 2025 outlook appears highly favourable, driven by institutional adoption and regulatory developments.
placeholder
Solana Price Forecast: SOL flashes bearish signals, risks double-digit crashSolana (SOL) price shows early signs of a potential breakdown as it trades lower at $165.40 on Monday. SOL is approaching a key support level that could determine its next major move. Technical indicators flash red, and bearish sentiment intensifies, with short positions hitting a monthly high.
Author  FXStreet
May 19, Mon
Solana (SOL) price shows early signs of a potential breakdown as it trades lower at $165.40 on Monday. SOL is approaching a key support level that could determine its next major move. Technical indicators flash red, and bearish sentiment intensifies, with short positions hitting a monthly high.
placeholder
XRP ETF approval chances soar to 83% despite SEC RoadblocksThe odds of the approved XRP ETF have surged to 83% amid growing institutional demand.
Author  Cryptopolitan
May 26, Mon
The odds of the approved XRP ETF have surged to 83% amid growing institutional demand.
placeholder
Ethereum Price Faces Pressure: Can It Sustain Its Recent Rally?Ethereum price found support at $2,460 and started a fresh increase. ETH is now struggling and might drop again below the $2,500 support.
Author  NewsBTC
May 27, Tue
Ethereum price found support at $2,460 and started a fresh increase. ETH is now struggling and might drop again below the $2,500 support.
placeholder
Dogecoin Follows Bearish June Trend With over 4% Losses – Is The Worst Over?The month of June has been historically bearish for the Dogecoin price, and so far, June 2025 is following the same trend. With just a little over a week into the month, the Dogecoin price has already seen a decline of over 4%, suggesting it is sticking to the established trend. If this is the […]
Author  Bitcoinist
Jun 09, Mon
The month of June has been historically bearish for the Dogecoin price, and so far, June 2025 is following the same trend. With just a little over a week into the month, the Dogecoin price has already seen a decline of over 4%, suggesting it is sticking to the established trend. If this is the […]
Related Instrument
goTop
quote