NZD/JPY Price Forecast: Surges above key resistance near 88.00

Source Fxstreet
  • NZD/JPY rallies to 87.69 after bouncing from intraday low near 86.56.
  • RSI flattens near 60, signaling potential pause before next leg higher.
  • Bulls aim for 88.00, 89.71 YTD high, and psychological 90.00 barrier.

The NZD/JPY rallied sharply and posted gains of over 1%, trading at 87.69 after bouncing off daily lows of 86.56, clearing key technical resistance levels, as the pair seems poised to challenge the year-to-date (YTD) high of 89.71.

NZD/JPY Price Forecast: Technical outlook

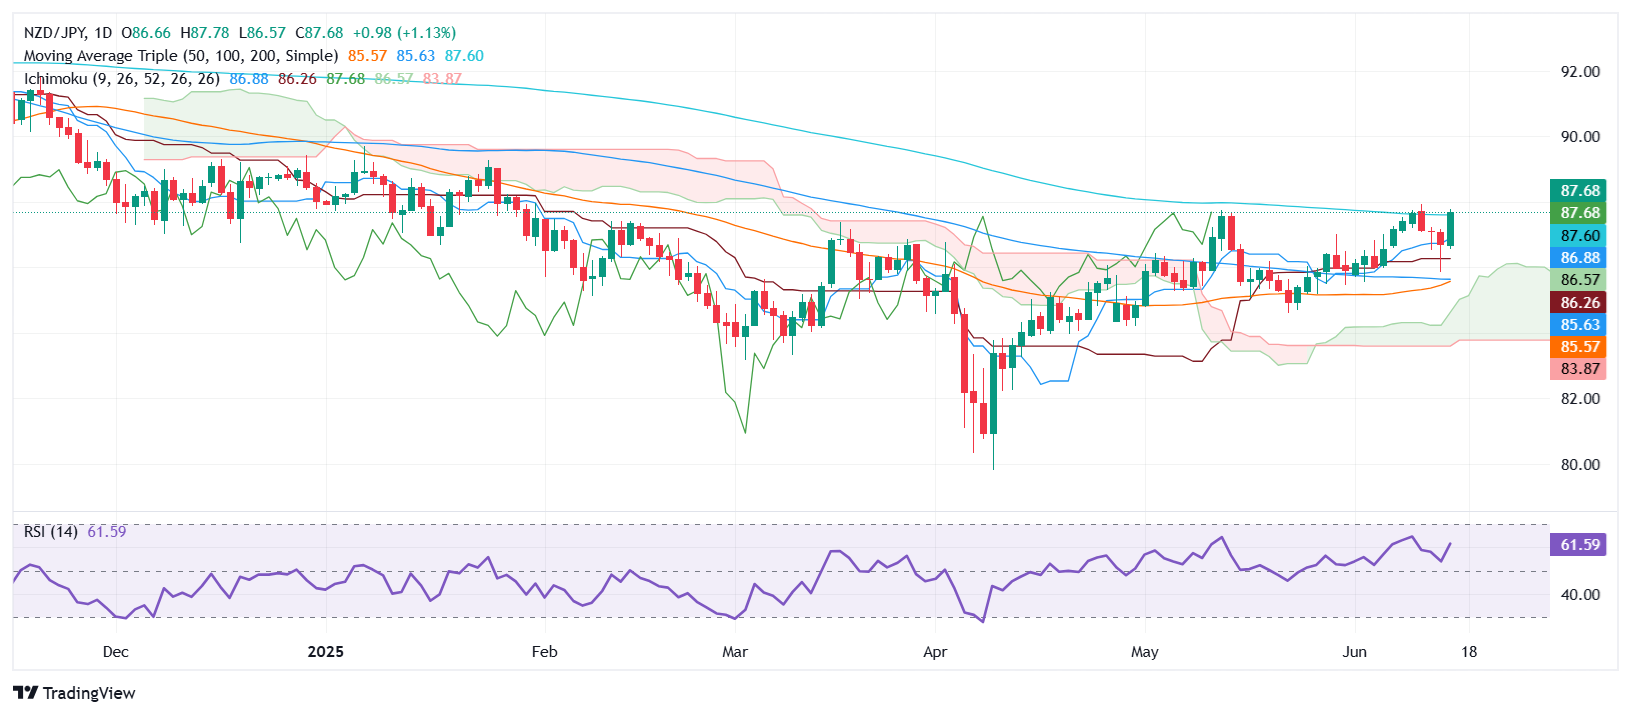
The NZD/JPY appears poised to surpass the May 13 daily high of 87.73, potentially opening the door for further upside. Momentum, as measured by the Relative Strength Index (RSI), indicates that buyers are taking a respite, with the RSI turning flat after reaching the 60 threshold. Therefore, some consolidation lies ahead.

Despite this, the path of least resistance is tilted upward. With that said, the NZD/JPY first resistance would be the 88.00 figure. Once cleared, the next stop would be 89.00, followed by the YTD peak of 89.71 before challenging the 90.00 figure.

Conversely, the least likely path is that the first support for the NZD/JPY would be at 87.00, followed by the Tenkan-sen at 86.88, ahead of the Senkou Span A at 86.57. If surpassed, the next floor level would be the Kijun-Sen at 86.26.

NZD/JPY Price Chart – Daily

New Zealand Dollar PRICE This week

The table below shows the percentage change of New Zealand Dollar (NZD) against listed major currencies this week. New Zealand Dollar was the strongest against the US Dollar.

USD EUR GBP JPY CAD AUD NZD CHF
USD 0.02% 0.02% 0.00% 0.01% 0.02% -0.05% 0.03%
EUR -0.02% -0.02% 0.03% -0.01% 0.04% 0.01% 0.00%
GBP -0.02% 0.02% -0.04% 0.00% 0.05% -0.01% 0.02%
JPY 0.00% -0.03% 0.04% 0.00% 0.00% -0.05% 0.00%
CAD -0.01% 0.01% -0.00% -0.00% -0.07% 0.00% 0.02%
AUD -0.02% -0.04% -0.05% -0.00% 0.07% -0.03% -0.03%
NZD 0.05% -0.01% 0.01% 0.05% -0.01% 0.03% 0.00%
CHF -0.03% -0.00% -0.02% -0.00% -0.02% 0.03% -0.00%

The heat map shows percentage changes of major currencies against each other. The base currency is picked from the left column, while the quote currency is picked from the top row. For example, if you pick the New Zealand Dollar from the left column and move along the horizontal line to the US Dollar, the percentage change displayed in the box will represent NZD (base)/USD (quote).

Disclaimer: For information purposes only. Past performance is not indicative of future results.
placeholder
Ethereum (ETH) Price Closes Above $3,900 — Is a New All-Time High Possible Before 2024 Ends?Once again, the price of Ethereum (ETH) has risen above $3,900. This bounce has hinted at a further price increase for the altcoin before the end of the year.
Author  Beincrypto
Dec 17, 2024
Once again, the price of Ethereum (ETH) has risen above $3,900. This bounce has hinted at a further price increase for the altcoin before the end of the year.
placeholder
ECB Policy Outlook for 2026: What It Could Mean for the Euro’s Next MoveWith the ECB likely holding rates steady at 2.15% and the Fed potentially extending cuts into 2026, EUR/USD may test 1.20 if Eurozone growth proves resilient, but weaker growth and an ECB pivot could pull the pair back toward 1.13 and potentially 1.10.
Author  Mitrade
Dec 26, 2025
With the ECB likely holding rates steady at 2.15% and the Fed potentially extending cuts into 2026, EUR/USD may test 1.20 if Eurozone growth proves resilient, but weaker growth and an ECB pivot could pull the pair back toward 1.13 and potentially 1.10.
placeholder
My Top 5 Stock Market Predictions for 2026Five 2026 market predictions written in a native, news-style voice: AI’s winners and losers, broader sector leadership, dividend demand, valuation cooling as the Shiller CAPE sits at 39 (Dec. 31, 2025), and quantum-computing bursts—while keeping all original facts and numbers unchanged.
Author  Mitrade
Jan 06, Tue
Five 2026 market predictions written in a native, news-style voice: AI’s winners and losers, broader sector leadership, dividend demand, valuation cooling as the Shiller CAPE sits at 39 (Dec. 31, 2025), and quantum-computing bursts—while keeping all original facts and numbers unchanged.
placeholder
Gold rises as safe-haven demand increases on Iran warGold price (XAU/USD) extends its gains for the second successive session on Thursday as traders seek safety amid the ongoing war in the Middle East.
Author  FXStreet
Mar 05, Thu
Gold price (XAU/USD) extends its gains for the second successive session on Thursday as traders seek safety amid the ongoing war in the Middle East.
placeholder
Gold slumps to near $5,050 on oil-driven inflation fears, stronger US DollarGold price (XAU/USD) falls to around $5,065 during the early Asian session on Monday, pressured by a stronger US Dollar (USD) and inflationary risks. Traders will closely monitor the developments surrounding the US-Iran conflicts and geopolitical risks in the Middle East.
Author  FXStreet
Yesterday 01: 41
Gold price (XAU/USD) falls to around $5,065 during the early Asian session on Monday, pressured by a stronger US Dollar (USD) and inflationary risks. Traders will closely monitor the developments surrounding the US-Iran conflicts and geopolitical risks in the Middle East.
Related Instrument
goTop
quote