


AUD/USD Price Forecast: Breakdown of H&S pattern keeps the pair under pressure
- AUD/USD declines to near 0.6833 as the Australian Dollar underperforms.
- The Fed is certain to hike interest rates in the December meeting.
- Investors keenly await RBA's monetary policy minutes and Governor Michele Bullock's speech.
The Australian Dollar (AUD) underperforms its currency peers on Thursday, trading 0.15% down at around 0.6833 against the US Dollar (USD) during the European trade. The Australian currency is under pressure as market experts doubt the continuation of Reserve Bank of Australia’s (RBA) monetary tightening cycle.
Australian Dollar Price Today
The table below shows the percentage change of Australian Dollar (AUD) against listed major currencies today. Australian Dollar was the weakest against the Swiss Franc.
| USD | EUR | GBP | JPY | CAD | AUD | NZD | CHF | |
|---|---|---|---|---|---|---|---|---|
| USD | -0.02% | 0.03% | -0.13% | -0.03% | 0.30% | 0.00% | -0.17% | |
| EUR | 0.02% | 0.06% | -0.11% | -0.01% | 0.33% | 0.03% | -0.14% | |
| GBP | -0.03% | -0.06% | -0.15% | -0.08% | 0.28% | -0.03% | -0.20% | |
| JPY | 0.13% | 0.11% | 0.15% | 0.09% | 0.43% | 0.12% | -0.04% | |
| CAD | 0.03% | 0.01% | 0.08% | -0.09% | 0.33% | 0.04% | -0.13% | |
| AUD | -0.30% | -0.33% | -0.28% | -0.43% | -0.33% | -0.29% | -0.46% | |
| NZD | -0.01% | -0.03% | 0.03% | -0.12% | -0.04% | 0.29% | -0.14% | |
| CHF | 0.17% | 0.14% | 0.20% | 0.04% | 0.13% | 0.46% | 0.14% |
The heat map shows percentage changes of major currencies against each other. The base currency is picked from the left column, while the quote currency is picked from the top row. For example, if you pick the Australian Dollar from the left column and move along the horizontal line to the US Dollar, the percentage change displayed in the box will represent AUD (base)/USD (quote).
Analysts at OCBC Group Research highlighted the mixed signals in the last RBA’s decision, noting that while the statement cited that “inflation remains elevated and recent data indicate that it is broadly based” to justify the hike, it also acknowledged that “the increases in the cash rate target since the beginning of the year have tightened financial conditions. The economy is slowing, housing prices have fallen significantly and the unemployment rate has risen”.
OCBC further point out that the RBA has softened its forward guidance, with the statement having removed the phrase “including increasing the cash rate target further if needed”. Against this backdrop, OCBC concludes: “We expect no more hike in this cycle, and the next policy move is likely to be a cut.”
For fresh cues regarding RBA’s monetary policy outlook, investors will pay attention to monetary policy meeting minutes of the October policy meeting and Governor Michele Bullock’s speech scheduled on Tuesday.
Meanwhile, the broader strength in the US Dollar is also keeping the Aussie pair under pressure. As of writing, the US Dollar Index (DXY) trades flat at around 102.86 after giving back it early gains. During the day, the DXY posted a fresh 18-month high at 103.08.
Dollar index hits fresh high as Fed hike expectations firm into year end
Analysts at MUFG note that the US Dollar has “continued to strengthen overnight,” pushing the Dollar Index to “a fresh year-to-date high of 103.08.” They argue that the Dollar’s “renewed upward momentum has been encouraged by expectations that the Fed is likely to speed up the pace of rate hikes in response to the recent run of stronger US inflation data.” In rates, MUFG highlights that “the yield on the 2-year US Treasury has jumped high by around 33bps from the low at the end of last week although still remains below the peak set in September at 4.96%.”
On the policy outlook, MUFG points out that “a 25bps rate hike at the next FOMC meeting in December is now fully priced in, and market participants have moved further to price in small probability of larger 50bps hike.” They add that “there are currently around 28bps of hikes priced by December, and 43bps of hikes priced by the following meeting in January indicating that even if the Fed hikes by 25bps in December it is now expected to quickly follow up with another 25bps hike at the start of next year.”
According to MUFG, market expectations for a faster pace of Fed tightening have been “encouraged by hawkish comments this week by Fed officials.” They cite Governor Christopher Waller, who “stated he would consider voting for a larger 50bps hike in December,” and Dallas Fed President Lorie Logan, a current voting member, who said “the FOMC needs to implement at least two more 25bps rate increases” and that “it may be possible to move more rapidly this winter than the FOMC has moved this fall.” Chicago Fed President Austan Goolsbee, who becomes a voting member next year, also described the October CPI report as “another distressing report, borderline disturbing,” particularly highlighting that services inflation “has remained persistently high.”
MUFG stresses that “the updated views of New York Fed President John Williams could carry more weight.” They recall his recent remark that it is an “appropriate time to accumulate more information to help us determine what the appropriate stance of policy is to make sure we achieve a timely return to our 2% target.” While MUFG does not expect “a larger 50bps hike to be delivered in December,” they judge that “it is more likely now that the Fed could hike rates back-to-back in December and January.”
In their view, this evolving policy narrative is “a development that will encourage the US dollar to trade at stronger levels heading into year end.” MUFG concludes that “a sharp tightening of US financial conditions and/or ongoing drop in energy prices would likely be required to significantly push back against market expectations for faster Fed hikes at the current juncture.”
AUD/USD Technical Analysis
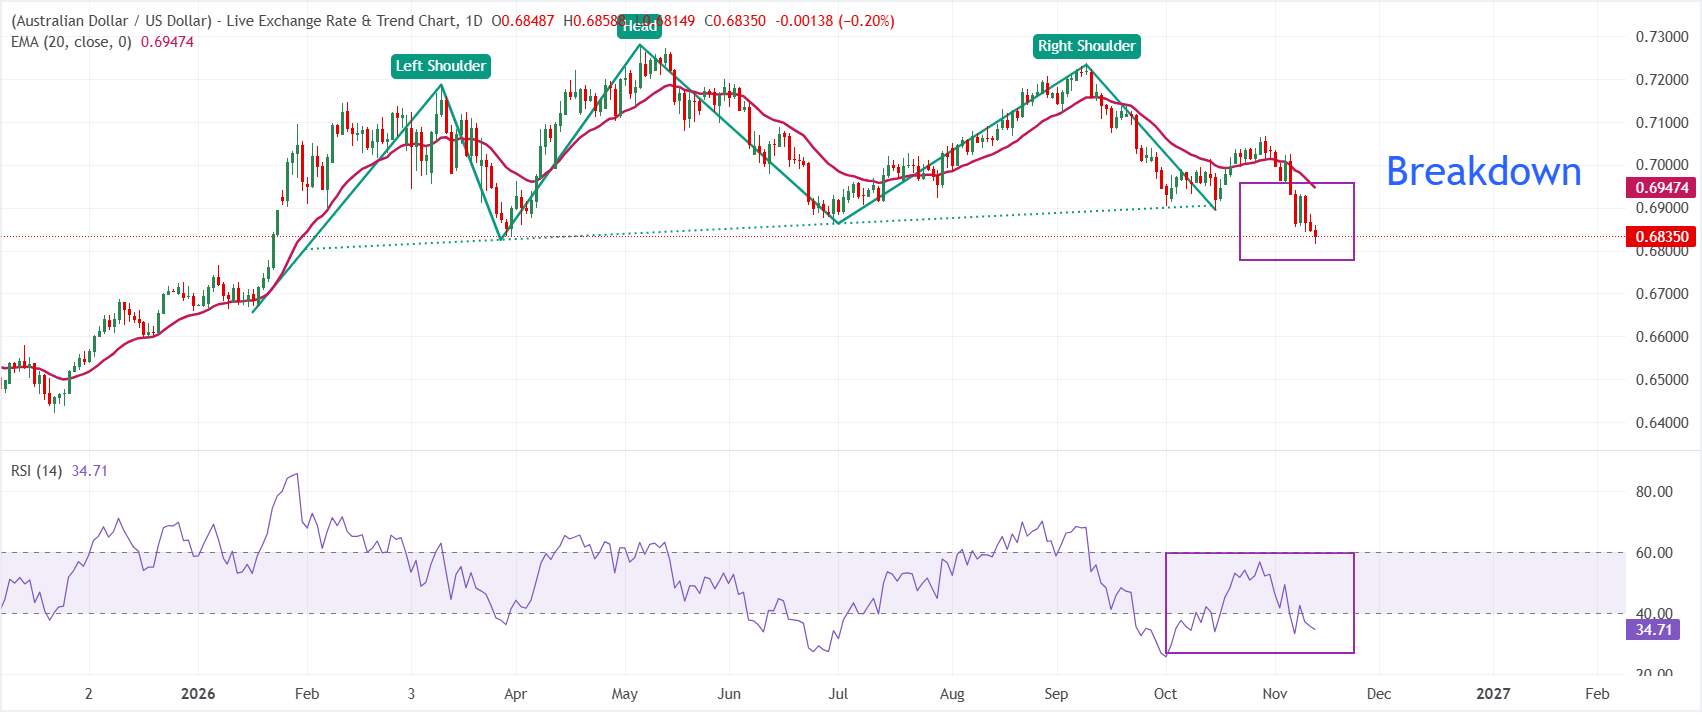
In the daily chart, AUD/USD trades at 0.6835, maintaining a bearish near-term bias as spot holds clearly below the 20-period exponential moving average (EMA) at 0.6947. The location of price under this key trend reference and the breakdown of the Head and Shoulder (H&S) chart pattern hint that recent rebounds remain capped, while the Relative Strength Index (14) around 35 stays in weak territory, suggesting only modest downside momentum rather than outright oversold conditions.
On the topside, initial resistance is located at the neckline of the H&S pattern, which is at 0.6900, followed by the 20-period EMA at 0.6947, and a decisive recovery above this barrier would be needed to ease immediate selling pressure and open the way for a broader corrective bounce. Looking down, the pair could extend its decline towards 0.6800.
(The technical analysis of this story was written with the help of an AI tool. Know more.)
Economic Indicator
RBA Governor Bullock speech
Michele Bullock is the the ninth Governor of the Reserve Bank of Australia. She commenced her current position in September 2023, replacing Philip Lowe. Bullock was the Assistant Governor (Financial System) at the Reserve Bank of Australia, a position she held since October 2016.
Read more.Recommended Articles


