

USD/CHF Price Forecast: RSI turns bullish as 0.8300 comes into view

Source Fxstreet
  • USD/CHF reclaims 50-day SMA at 0.8227, extending its recovery.
  • RSI crosses above neutral, reinforcing bullish momentum near 0.8250.
  • Daily close above 0.8250 exposes 0.8300, followed by 0.8382.

The USD/CHF climbed on Tuesday during the North American session, up 0.74%, as hawkish comments by Federal Reserve (Fed) officials and a high US inflation report bolstered the US Dollar amid growing expectations of a Fed rate hike in December.

USD/CHF Price Forecast: Technical outlook

After falling to a nearly two-month low of 0.8127, the USD/CHF has recovered some ground. As of writing, the pair has cleared the 50-day Simple Moving Average (SMA) at 0.8227 and reached a high of 0.8270, but has retreated towards 0.8250, a nearly seven-day high.

The Relative Strength Index (RSI) cleared its 50-neutral level, as buyers gain momentum. This, along with a daily close above 0.8250, could cement the case for a recovery towards the 0.8300 level. Above this level, the next area of interest would be the year-to-date high of 0.8382, reached on October 1.

On the downside, the first support for USD/CHF is the 50-day SMA. Once cleared, the next stop is the low of the day at 0.8174, followed by the 100-day SMA at 0.8164. Below is the 0.8100 figure, ahead of the 200-day SMA lying at 0.8009.

USD/CHF Price Chart – Daily
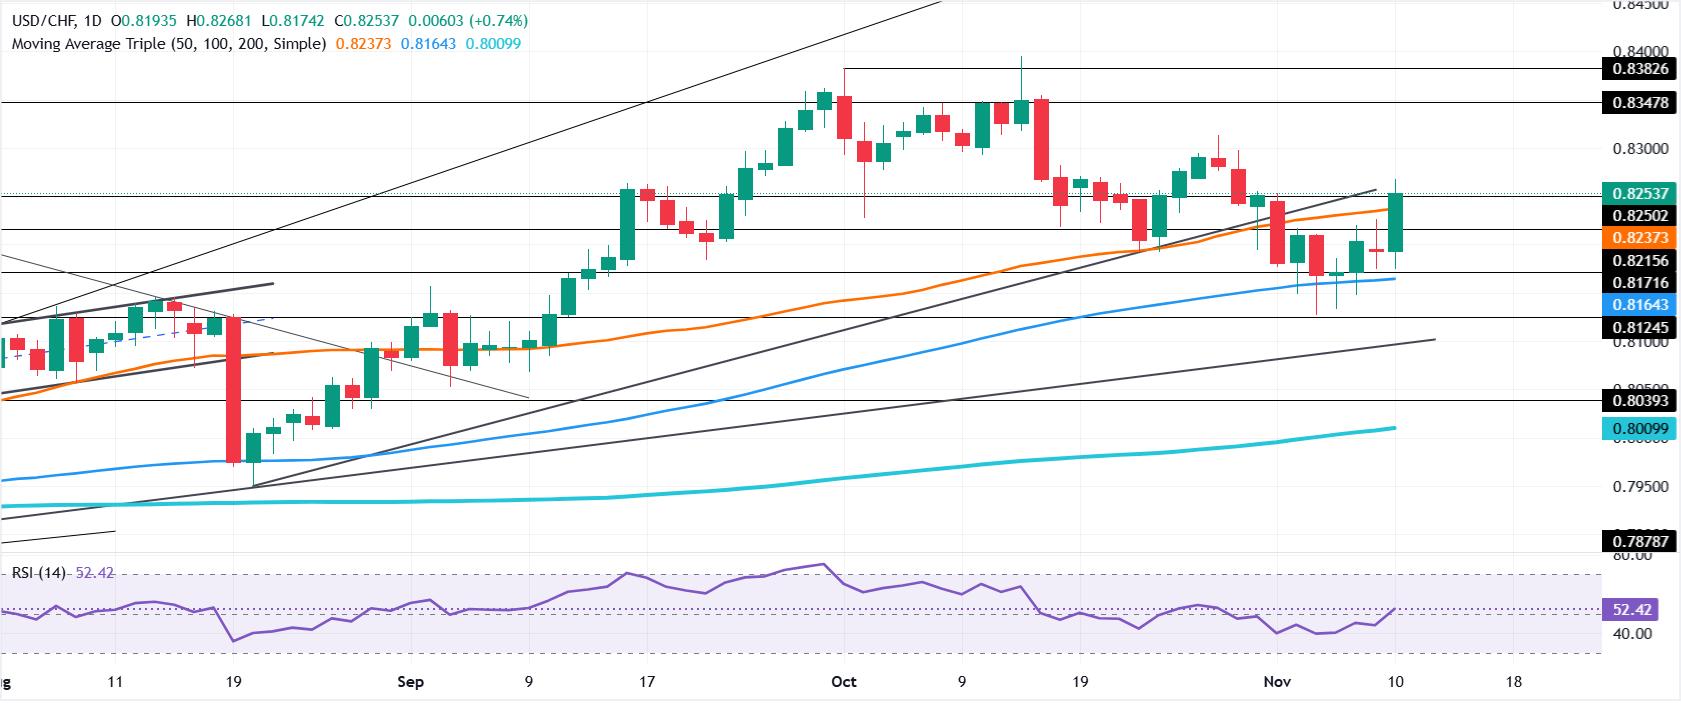
USD/CHF daily chart

Swiss Franc Price Today

The table below shows the percentage change of Swiss Franc (CHF) against listed major currencies today. Swiss Franc was the strongest against the Australian Dollar.

USD EUR GBP JPY CAD AUD NZD CHF
USD 0.53% 0.73% 0.57% 0.48% 0.90% 0.54% 0.72%
EUR -0.53% 0.19% 0.04% -0.04% 0.37% 0.02% 0.22%
GBP -0.73% -0.19% -0.17% -0.23% 0.17% -0.19% 0.00%
JPY -0.57% -0.04% 0.17% -0.08% 0.32% -0.02% 0.16%
CAD -0.48% 0.04% 0.23% 0.08% 0.40% 0.05% 0.24%
AUD -0.90% -0.37% -0.17% -0.32% -0.40% -0.36% -0.16%
NZD -0.54% -0.02% 0.19% 0.02% -0.05% 0.36% 0.18%
CHF -0.72% -0.22% -0.01% -0.16% -0.24% 0.16% -0.18%

The heat map shows percentage changes of major currencies against each other. The base currency is picked from the left column, while the quote currency is picked from the top row. For example, if you pick the Swiss Franc from the left column and move along the horizontal line to the US Dollar, the percentage change displayed in the box will represent CHF (base)/USD (quote).

Disclaimer: For information purposes only. Past performance is not indicative of future results.
placeholder
China's factories are pricing in 5.7%. Its shoppers are pricing in 0.7%.China's October PPI rose 5.7% year on year, the fastest since June 2022, while CPI slowed to 0.7% and core CPI to 0.8%. Input prices rose faster than factory-gate prices, squeezing mid-stream margins by roughly five percentage points. The Hang Seng fell 0.13% on a day the S&P 500 rose 2.35%, the only major market to sit out the risk-on session.
Author  Irene Q.
Nov 10, Tue
China's October PPI rose 5.7% year on year, the fastest since June 2022, while CPI slowed to 0.7% and core CPI to 0.8%. Input prices rose faster than factory-gate prices, squeezing mid-stream margins by roughly five percentage points. The Hang Seng fell 0.13% on a day the S&P 500 rose 2.35%, the only major market to sit out the risk-on session.
placeholder
Gold Price Analysis Today | Forex Gold Analysis | XAU/USD Analysis - November 11, 2026Get the latest gold price analysis, forex gold insights, and XAU/USD analysis for November 11, 2026. Read on for the details.
Author  Mitrade
Nov 11, Wed
Get the latest gold price analysis, forex gold insights, and XAU/USD analysis for November 11, 2026. Read on for the details.
placeholder
Bitcoin lost its 200-day average — but the exit started three sessions before the CPIBitcoin fell 2.5% to about $73,400 on 11 November, an 11-week low, breaking its 200-day moving average near $73,100. The 24-hour liquidation tally reached $632 to $705 million, roughly 82% of it longs. But spot ETF outflows began three sessions earlier and USDT's market cap has shrunk $6.6 billion in 60 days — the leveraged length left before the inflation print did. A double top at 81,890 and 81,080 leaves a measured target of 69,366.
Author  Suzie
Nov 11, Wed
Bitcoin fell 2.5% to about $73,400 on 11 November, an 11-week low, breaking its 200-day moving average near $73,100. The 24-hour liquidation tally reached $632 to $705 million, roughly 82% of it longs. But spot ETF outflows began three sessions earlier and USDT's market cap has shrunk $6.6 billion in 60 days — the leveraged length left before the inflation print did. A double top at 81,890 and 81,080 leaves a measured target of 69,366.
placeholder
Gold Extends Slide Below $4,000 as Rising US Inflation, Fed December Hike Bets Pressure Prices On November 12, gold prices (XAUUSD) extended their recent losses, falling further below $4,000 in early Asian trading to hit an intraday low near $3,968, marking a third consecutive day
Author  TradingKey
Yesterday 02: 00
On November 12, gold prices (XAUUSD) extended their recent losses, falling further below $4,000 in early Asian trading to hit an intraday low near $3,968, marking a third consecutive day
placeholder
Gold closed below $4,000 again — the ETF crowd and central banks stayed, the momentum money leftSpot gold is trading near $3,999, its third consecutive lower daily low, after a 5.00% 10-year yield and a 102.85 dollar index raised the odds of a December hike to 87%. But the selling is not coming from the strategic holders: managed-money net longs fell to 324 tonnes, a 21-week low, and Goldman Sachs attributes roughly 95% of five weeks of selling to non-reportable positions. ETFs still hold a record 4,256 tonnes and central banks bought 321 tonnes in Q3. The table below sets the triggers, directions and levels.
Author  Irene Q.
Yesterday 03: 20
Spot gold is trading near $3,999, its third consecutive lower daily low, after a 5.00% 10-year yield and a 102.85 dollar index raised the odds of a December hike to 87%. But the selling is not coming from the strategic holders: managed-money net longs fell to 324 tonnes, a 21-week low, and Goldman Sachs attributes roughly 95% of five weeks of selling to non-reportable positions. ETFs still hold a record 4,256 tonnes and central banks bought 321 tonnes in Q3. The table below sets the triggers, directions and levels.
Related Instrument
goTop
quote