


NZD/USD Price Forecast: Likely recover further to near 20-day EMA
- NZD/USD recovers further to near 0.5640 amid hawkish RBNZ outlook.
- Commerzback expects the RBNZ to hike interest rates in December.
- The US Dollar rebounds amid uncertainty ahead of US mid-term elections.
The New Zealand Dollar (NZD) extends its recovery to near 0.5640 against the US Dollar (USD) during the European trade on Friday. The Kiwi pair started rebounding after a mayhem on Wednesday, caused by Reserve Bank of New Zealand’s (RBNZ) unexpected decision to hold the Official Cash Rate (OCR) steady at 2.75%.
The RBNZ left its OCR steady at 2.75%, while it was expected to raise it to 3%. However, the RBNZ signaled that it is a temporary pause and the central bank will remain on the monetary tightening path, citing upside inflation risks.
NZ outlook steadied as Commerzbank sees RBNZ pause, not pivot
Analysts at Commerzbank argue that the RBNZ’s latest move should be seen as “more of a pause than a dovish pivot,” rather than the start of an easing cycle. They “continue to expect two further hikes, in December and 1Q27,” and suggest that this projected policy path “should limit further NZD downside” despite the currency’s recent weakness.
Meanwhile, the US Dollar attracts bids amid caution ahead of United States (US) mid-term elections next week. As of writing, the US Dollar Index (DXY), which gauges the Greenback’s value against six major currencies, trades almost flat at around 101.84 after clawing back its entire early losses.
US midterms set stage for divided government and policy gridlock risks
Analysts at Commerzbank argue that the US is “heading towards what is known as a ‘divided government’,” with a likely split between the White House and Congress. They note that in key areas for President Trump, “such as foreign and trade policy, he has in any case relied primarily on executive orders recently,” meaning much of his agenda can continue even if legislative progress slows.
NZD/USD Technical Analysis
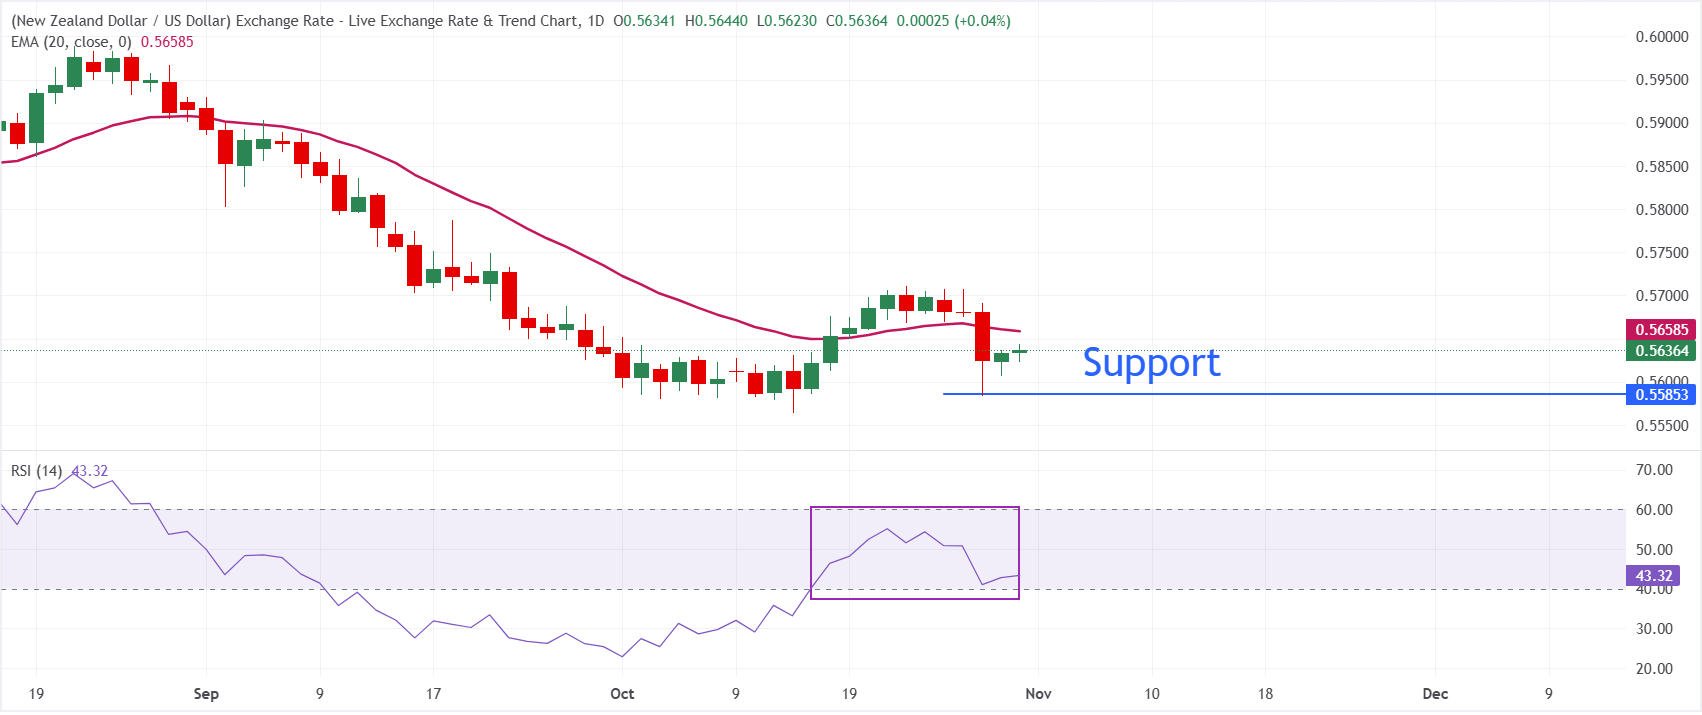
In the daily chart, NZD/USD trades at 0.5637, maintaining a bearish near-term tone as it remains under the 20-period Exponential Moving Average (EMA) at 0.5658. The pair has been unable to reclaim this short-term trend marker, suggesting that recent rebounds are still capped within a broader downswing, while the Relative Strength Index (RSI) at 43.4 stays below neutral, hinting at only modest recovery momentum.
On the topside, initial resistance is located at the 20-day EMA around 0.5658, where sellers are likely to defend the prevailing downtrend. On the downside, the October 28 low at 0.5584 is the key support level.
(The technical analysis of this story was written with the help of an AI tool. Know more.)
Economic Indicator
RBNZ Interest Rate Decision
The Reserve Bank of New Zealand (RBNZ) announces its interest rate decision after each of its seven scheduled annual policy meetings. If the RBNZ is hawkish and sees inflationary pressures rising, it raises the Official Cash Rate (OCR) to bring inflation down. This is positive for the New Zealand Dollar (NZD) since higher interest rates attract more capital inflows. Likewise, if it reaches the view that inflation is too low it lowers the OCR, which tends to weaken NZD.
Read more.Last release: Wed Oct 28, 2026 01:00
Frequency: Irregular
Actual: 2.75%
Consensus: 3%
Previous: 2.75%
Source: Reserve Bank of New Zealand
The Reserve Bank of New Zealand (RBNZ) holds monetary policy meetings seven times a year, announcing their decision on interest rates and the economic assessments that influenced their decision. The central bank offers clues on the economic outlook and future policy path, which are of high relevance for the NZD valuation. Positive economic developments and upbeat outlook could lead the RBNZ to tighten the policy by hiking interest rates, which tends to be NZD bullish. The policy announcements are usually followed by interim Governor Christian Hawkesby's press conference.
Recommended Articles


