


AUD/USD Price Forecast: 20-day EMA continues to lend support
- AUD/USD ticks lower to near 0.7025 as the US Dollar regains ground.
- Investors turn cautious ahead of US mid-term elections next week.
- Australian CPI data for Q3 and September remained stronger.
The Australian Dollar (AUD) trades subduedly at around 0.7025 against the US Dollar (USD) during the European trading session on Friday. The Aussie pair edges down as the US Dollar recovers its early losses, with financial markets turning cautious ahead of United States (US) mid-term elections next week.
As of writing, the US Dollar Index (DXY), which gauges the Greenback’s value against six major currencies, trades almost flat at around 101.82.
US midterms set stage for divided government and policy gridlock risks
Analysts at Commerzbank argue that the US is “heading towards what is known as a ‘divided government’,” with a likely split between the White House and Congress. They note that in key areas for President Trump, “such as foreign and trade policy, he has in any case relied primarily on executive orders recently,” meaning much of his agenda can continue even if legislative progress slows.
On the economic data front, preliminary US Q3 Gross Domestic Product (GDP) data has come in stronger-than-expected.
Economists at Commerzbank highlight that the US economy “expanded strongly by 3.4% in the third quarter of 2026,” with the Q3 GDP advance estimate coming in at “3.4% qoq annualised (Bloomberg consensus: 3.2%) vs 2.2% in Q2.” They note that “private consumption was the main driver and expanded 3.8%, at the same pace as Q2,” while “business investment, particularly in IT,” also contributed significantly to the robust outturn. At the same time, price pressures eased, with Commerzbank pointing out that “the GDP price index eased to 2.3% from 6.1% in Q2.”
However, the bank has warned that the economic growth could moderate amid concerns over Artificial Intelligence (AI) spending plans by hyperscalers.
Commerzbank has attributed this anticipated moderation to the fact that “financing conditions are no longer quite as favorable, and the boost from the AI boom is expected to subside, as is the stimulus from fiscal policy.”
On the Aussie front, the domestic Q3 and September Consumer Price Index (CPI) data arrived stronger this week.
Month-on-Month (MoM) CPI grew strongly by 0.8% vs. 0.7% estimates and the prior release of 0.4%. In the July-September period, price pressures rose in line with estimates of 1.3%, faster than the previous reading of 0.6%.
AUD/USD Technical Analysis
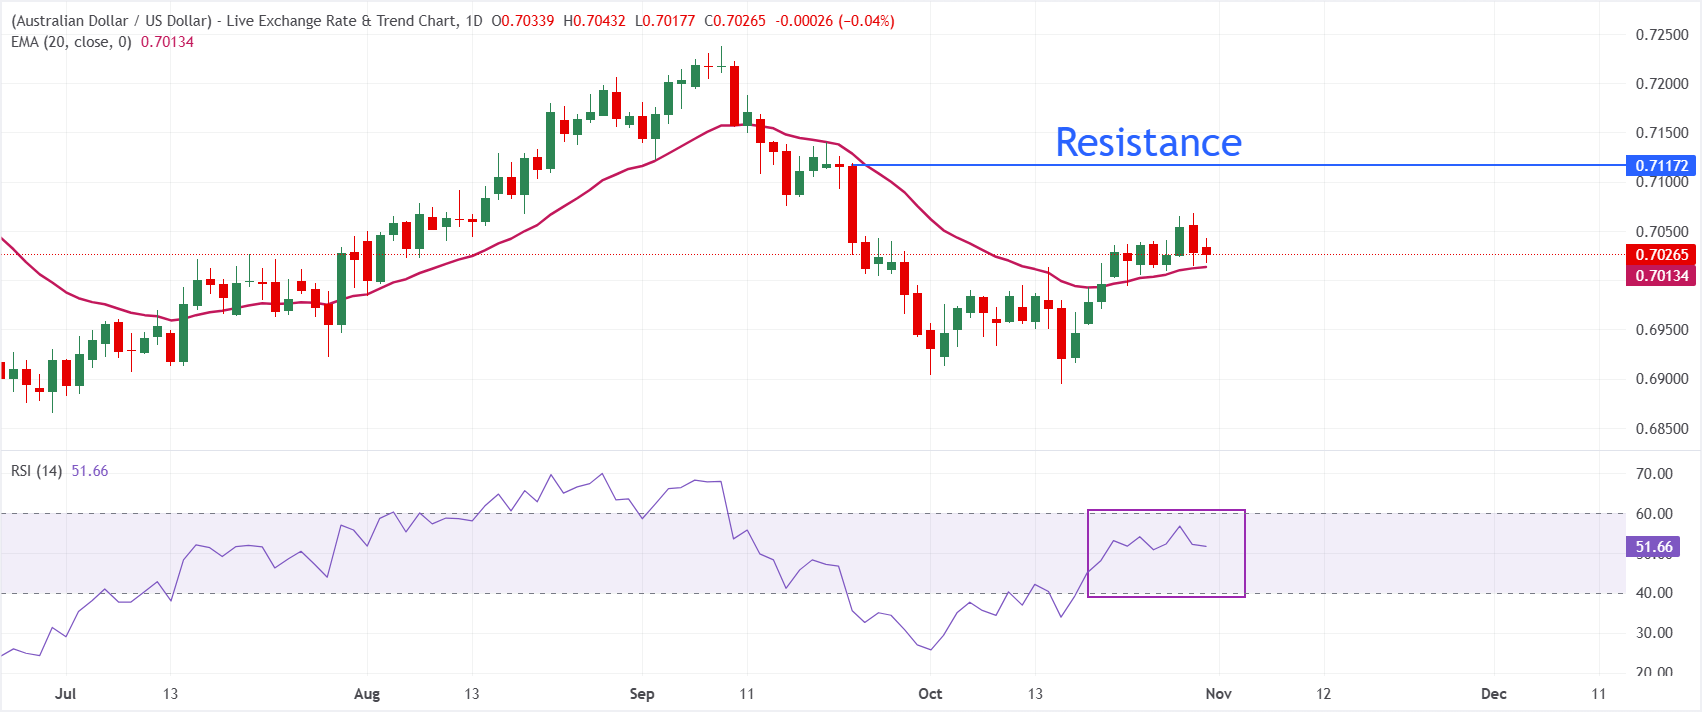
In the daily chart, AUD/USD trades at 0.7027. The pair holds a slight bullish bias as price remains just above the 20-period exponential moving average (EMA) at 0.7013, hinting at emerging underlying demand after the recent recovery from sub-0.70 levels.
The Relative Strength Index (RSI) at 51.7 is close to neutral but tilts higher, suggesting that upward momentum is modest yet constructive rather than overstretched.
On the downside, immediate support is seen at the 20-period EMA at 0.7013, with the 0.70 region acting as a broader psychological floor should sellers regain control. Looking up, the October 29 high at 0.7068 is the initiate hurdle; a decisive break above the same would strengthen the case for further upside towards the September 23 high at 0.7119.
(The technical analysis of this story was written with the help of an AI tool. Know more.)
Economic Indicator
Quarterly Consumer Price Index (QoQ)
The Consumer Price Index (CPI), released by the Australian Bureau of Statistics on a quarterly basis, measures the changes in the price of a fixed basket of goods and services acquired by household consumers. The quarterly CPI data series are calculated as the average of the three relevant monthly CPIs. The QoQ reading compares prices in the reference quarter to the previous quarter. A high reading is seen as bullish for the Australian Dollar (AUD), while a low reading is seen as bearish.
Read more.Last release: Wed Oct 28, 2026 00:30
Frequency: Quarterly
Actual: 1.3%
Consensus: 1.3%
Previous: 0.6%
Source: Australian Bureau of Statistics
The quarterly Consumer Price Index (CPI) published by the Australian Bureau of Statistics (ABS) has a significant impact on the market and the AUD valuation. The gauge is closely watched by the Reserve Bank of Australia (RBA), in order to achieve its inflation mandate, which has major monetary policy implications. Rising consumer prices tend to be AUD bullish, as the RBA could hike interest rates to maintain its inflation target. The data is released nearly 25 days after the quarter ends.
Recommended Articles


