


AUD/USD Price Forecast: Tests consolidation breakout near 0.7040
- AUD/USD corrects to near 0.7040 as the US Dollar regains ground.
- Hot Australian CPI data for Q3 and September has bolstered hawkish RBA expectations.
- Investors keenly await the US flash Q3 GDP and PCE Inflation data for September.
The Australian Dollar (AUD) is down 0.14% to near 0.7040 against the US Dollar (USD) during the European trading session on Thursday. The Aussie pair corrects from its fresh monthly high of 0.7068, as US Dollar regains ground ahead of the United States (US) flash Q3 Gross Domestic Product (GDP) and Personal Consumption Expenditure (PCE) Price Index data for September, which will be published at 12:30 GMT.
As of writing, the US Dollar Index (DXY), which gauges the Greenback’s value against six major currencies, trades 0.1% higher to near 102.20. On Wednesday, the USD Index came under pressure after the Federal Reserve’s (Fed) monetary policy announcement, in which it held the Federal Fund Rate steady in the 3.75%-4.00% range.
US growth seen resilient
According to TD Securities, upcoming US activity data are expected to underscore that the economy “will likely show a resilient economy that can handle more restriction.” The bank anticipates that “Q3 GDP [will] show robust underlying growth. In terms of the headline growth figures, TD Securities notes that “GDP growth picked up in Q3 to 2.5% from 2.2% previously with underlying activity remaining robust,” broadly in line with other projections that emphasize solid consumption and investment even as some components, such as net exports and inventories, act as modest drags.
Meanwhile, the core PCE Index, which is Fed’s preferred inflation gauge, is seen higher at 3.1% Year-on-Year (YoY) from the previous reading of 3%.
On the Aussie front, financial markets have become increasingly confident that the Reserve Bank of Australia (RBA) will hike interest rates in the November policy meeting, following hot Consumer Price Index (CPI) figures for the third quarter and September.
Australia inflation surprise bolsters RBA hike expectations and supports Aussie
Brown Brothers Harriman highlights that the latest Australia inflation data “beat expectations, strengthening the case for another RBA hike and underpinning AUD.” The bank notes that “September headline CPI rose 4.3% y/y (consensus: 4.2%) vs. 4.0% in August,” with the upside surprise “reflecting rising housing and transport costs,” reinforcing market pricing for further policy tightening.
AUD/USD Technical Analysis
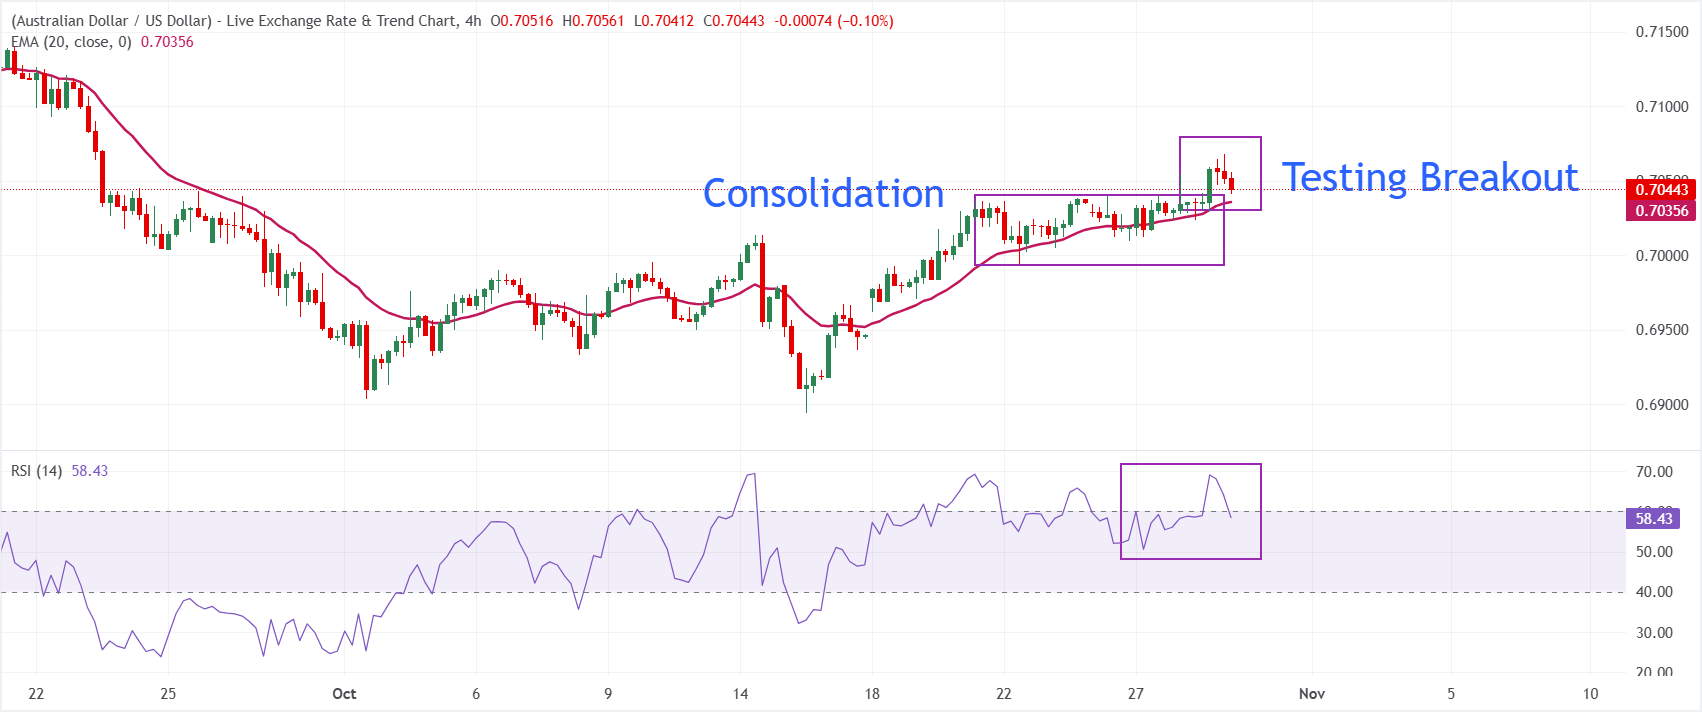
In the four-hour chart, AUD/USD tests the breakout of the consolidation that took place in the range between 0.6994 and 0.7040.
The pair retains a modest bullish bias as it holds above the 20-period Exponential Moving Average (EMA) at 0.7036, suggesting underlying demand on shallow pullbacks.
The Relative Strength Index (RSI) at 58 keeps a mildly constructive tone, indicating positive momentum without reaching overbought conditions.
On the downside, immediate support is seen at the 20-period EMA at 0.7036, before the lower-end of the above-mentioned consolidation range at 0.6994. Looking up, the pair would aim to extend the advance towards 0.7100 if it manages to attracts bids near the testing zone.
(The technical analysis of this story was written with the help of an AI tool. Know more.)
Economic Indicator
Quarterly Consumer Price Index (QoQ)
The Consumer Price Index (CPI), released by the Australian Bureau of Statistics on a quarterly basis, measures the changes in the price of a fixed basket of goods and services acquired by household consumers. The quarterly CPI data series are calculated as the average of the three relevant monthly CPIs. The QoQ reading compares prices in the reference quarter to the previous quarter. A high reading is seen as bullish for the Australian Dollar (AUD), while a low reading is seen as bearish.
Read more.Last release: Wed Oct 28, 2026 00:30
Frequency: Quarterly
Actual: 1.3%
Consensus: 1.3%
Previous: 0.6%
Source: Australian Bureau of Statistics
The quarterly Consumer Price Index (CPI) published by the Australian Bureau of Statistics (ABS) has a significant impact on the market and the AUD valuation. The gauge is closely watched by the Reserve Bank of Australia (RBA), in order to achieve its inflation mandate, which has major monetary policy implications. Rising consumer prices tend to be AUD bullish, as the RBA could hike interest rates to maintain its inflation target. The data is released nearly 25 days after the quarter ends.
Recommended Articles


