


Gold Price Forecast: Why Are Gold Prices Still Falling as the Fed Pauses Rate Hikes? September PCE May Determine Direction
TradingKey - On Thursday (October 29), gold prices (XAUUSD) continued to pull back after the Federal Reserve announced its latest interest rate decision. As of the Asian session on October 29, gold prices were trading lower near $4,025, with an intraday decline of around 1%. Although the Fed held interest rates steady as expected, the market remains cautious about the U.S. inflation outlook. The September PCE data scheduled for release today may determine gold's short-term direction.
Fed Holds Rates Unchanged; September PCE to Impact December Rate Hike Expectations
On Wednesday, Oct. 28, Eastern Time, the Federal Reserve announced it would keep the target range for the federal funds rate unchanged at 3.75%–4.00%, in line with market expectations. The decision was approved by a 10–2 vote, with two dissenters favoring a 25-basis-point rate hike.
In its policy statement, the Fed noted that U.S. economic activity continues to grow at a solid pace, domestic consumption remains resilient, and job growth broadly aligns with labor supply, though inflation remains elevated. Fed Chair Kevin Warsh stated that the U.S. economy shows no clear signs of overheating and that monetary policy must continue to be guided by economic data.
Although no rate hike occurred at this meeting, the Fed gave no clear signals of a rate cut. According to the CME FedWatch Tool, following the announcement, market expectations for a December rate hike dropped from 84% to around 78%. This indicates that the market has slightly trimmed expectations for further monetary policy tightening by year-end, though a rate hike remains the primary priced-in scenario.
Gold failed to sustain gains despite the declining probability of a rate hike, pulling back to near $4,040 during Thursday's Asian trading session. On one hand, the Fed's positive outlook on economic growth dampened market expectations for short-term monetary easing; on the other hand, persistent U.S. inflationary pressures and a higher rate environment continued to cap gold's rebound.
Next, market focus shifts to today's upcoming release of the U.S. September PCE price index. Based on market expectations, headline PCE is currently projected to rise 3.6% year-over-year, up from 3.4% in August, and 0.5% month-over-month, above the previous reading of 0.3%. Core PCE is expected to rise 3.1% year-over-year, up from 3.0% in August, and 0.3% month-over-month, higher than the prior reading of 0.2%.
Overall, the market expects U.S. inflation pressures to pick up in September, with rising energy prices potentially pushing headline PCE further higher. The previously released September CPI and PPI data both showed an acceleration in U.S. inflation; thus, whether this PCE reading confirms a resurgence in core inflation will serve as a key basis for assessing whether the Fed will raise rates again in December.
If core PCE comes in higher than expected—especially if the month-over-month increase hits 0.4% or above—it could lead the market to further boost the odds of a December rate hike, potentially strengthening the U.S. dollar and Treasury yields and weighing on gold. Conversely, if core PCE comes in below expectations, such as a month-over-month rise of just 0.2%, it would suggest underlying inflation pressures may not be as strong as indicated by the earlier CPI and PPI readings. In that case, the market could lower year-end rate hike expectations, creating conditions for a rebound in gold.
Gold Price Technical Analysis
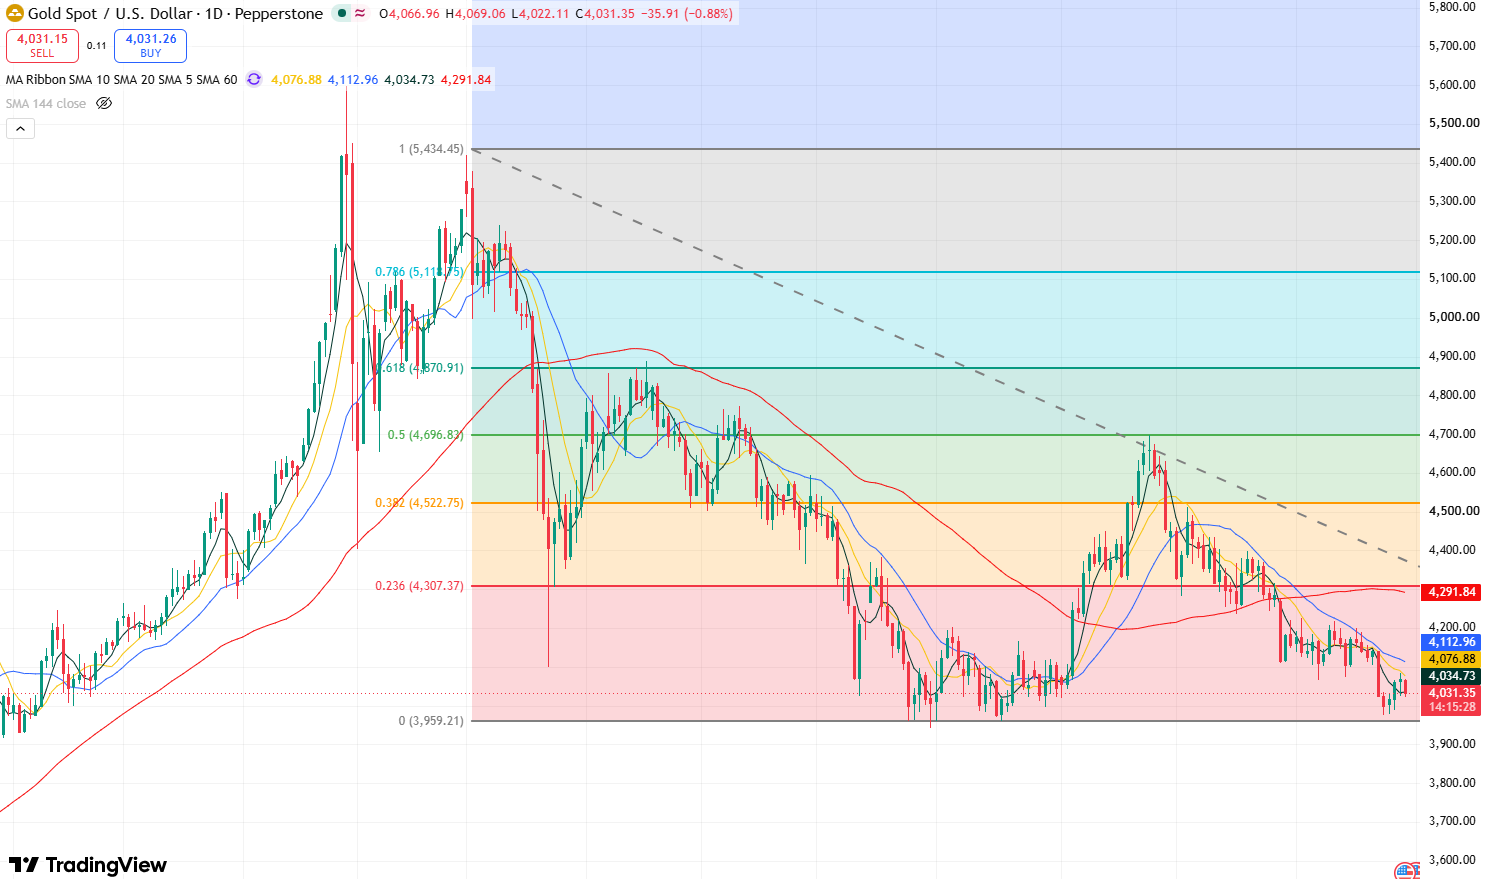
Gold Price Daily Chart, Source: TradingView
Looking at the daily chart, gold has pulled back continuously from above $4,200 recently. Although it temporarily found support near $3,980 this week, its rebound encountered resistance near $4,080 again, and it is currently back around $4,030, indicating that short-term downside pressure has not been fully dissipated.
Regarding technical indicators, the Relative Strength Index (RSI) stands around 38.7 and has not yet entered oversold territory, indicating that bears clearly hold the upper hand in market sentiment. Meanwhile, gold price movements have been continuously capped by the 10-day and 20-day moving averages recently, further demonstrating that the short-term trend leans downward.
Currently, initial support below lies in the $4,000–$3,980 range. If the September PCE comes in higher than expected and pushes gold below $3,980, prices may further test support near $3,940. If this support fails to hold, gold could experience a deeper pullback toward the $3,900 mark.
Conversely, if the September PCE data indicates cooling inflation, it could support gold to test the resistance level at $4,080 again. If it breaks above this level, gold may test the $4,100–$4,140 range. A decisive breakout and consolidation above $4,140 would open up upside potential toward $4,200.
Recommended Articles


