


AUD/USD Price Forecast: Aussie bears aim for a key support area around 0.7110
- AUD/USD extends its reversal from the 0.7248 area last week to the lower range of the 0.7100s.
- Growing bets on Fed monetary tightening and higher Oil prices are weighing on the AUD.
- A clear break of the 0.7110 area would confirm a deeper correction.
The Australian Dollar (AUD) resumed its downtrend against the US Dollar (USD) on Monday, weighed by the risk-off market mood, as Oil prices consolidate above $100, and rising bets that the Federal Reserve (Fed) will hike interest rates on Wednesday. The AUD/USD has extended its reversal from last week’s highs near 0.7240 to session lows a few pips above the support area around 0.7110, which is coming under pressure, ahead of the US session opening.
Investors have ramped up bets of a quarter-point rate hike by the Fed on Wednesday, and probably another one before year-end, after US Consumer Price Index data confirmed on Friday that inflation keeps growing at levels well above the Fed’s 2% target rate.
Meanwhile, Crude Oil prices remain above the key $100 level, as the situation in the Middle East complicates further. A series of attacks on commercial vessels keep the Strait of Hormuz practically closed, and the Iran-backed Houthis have threatened to blockade the Bab el-Mandeb Strait. This has been the alternative route for Oil exports from Gulf countries, and its closure would force them to reroute shipping through the Suez Canal, which would increase Freight prices exponentially.
Technical Analysis: Bears are likely to test key support around 0.7110
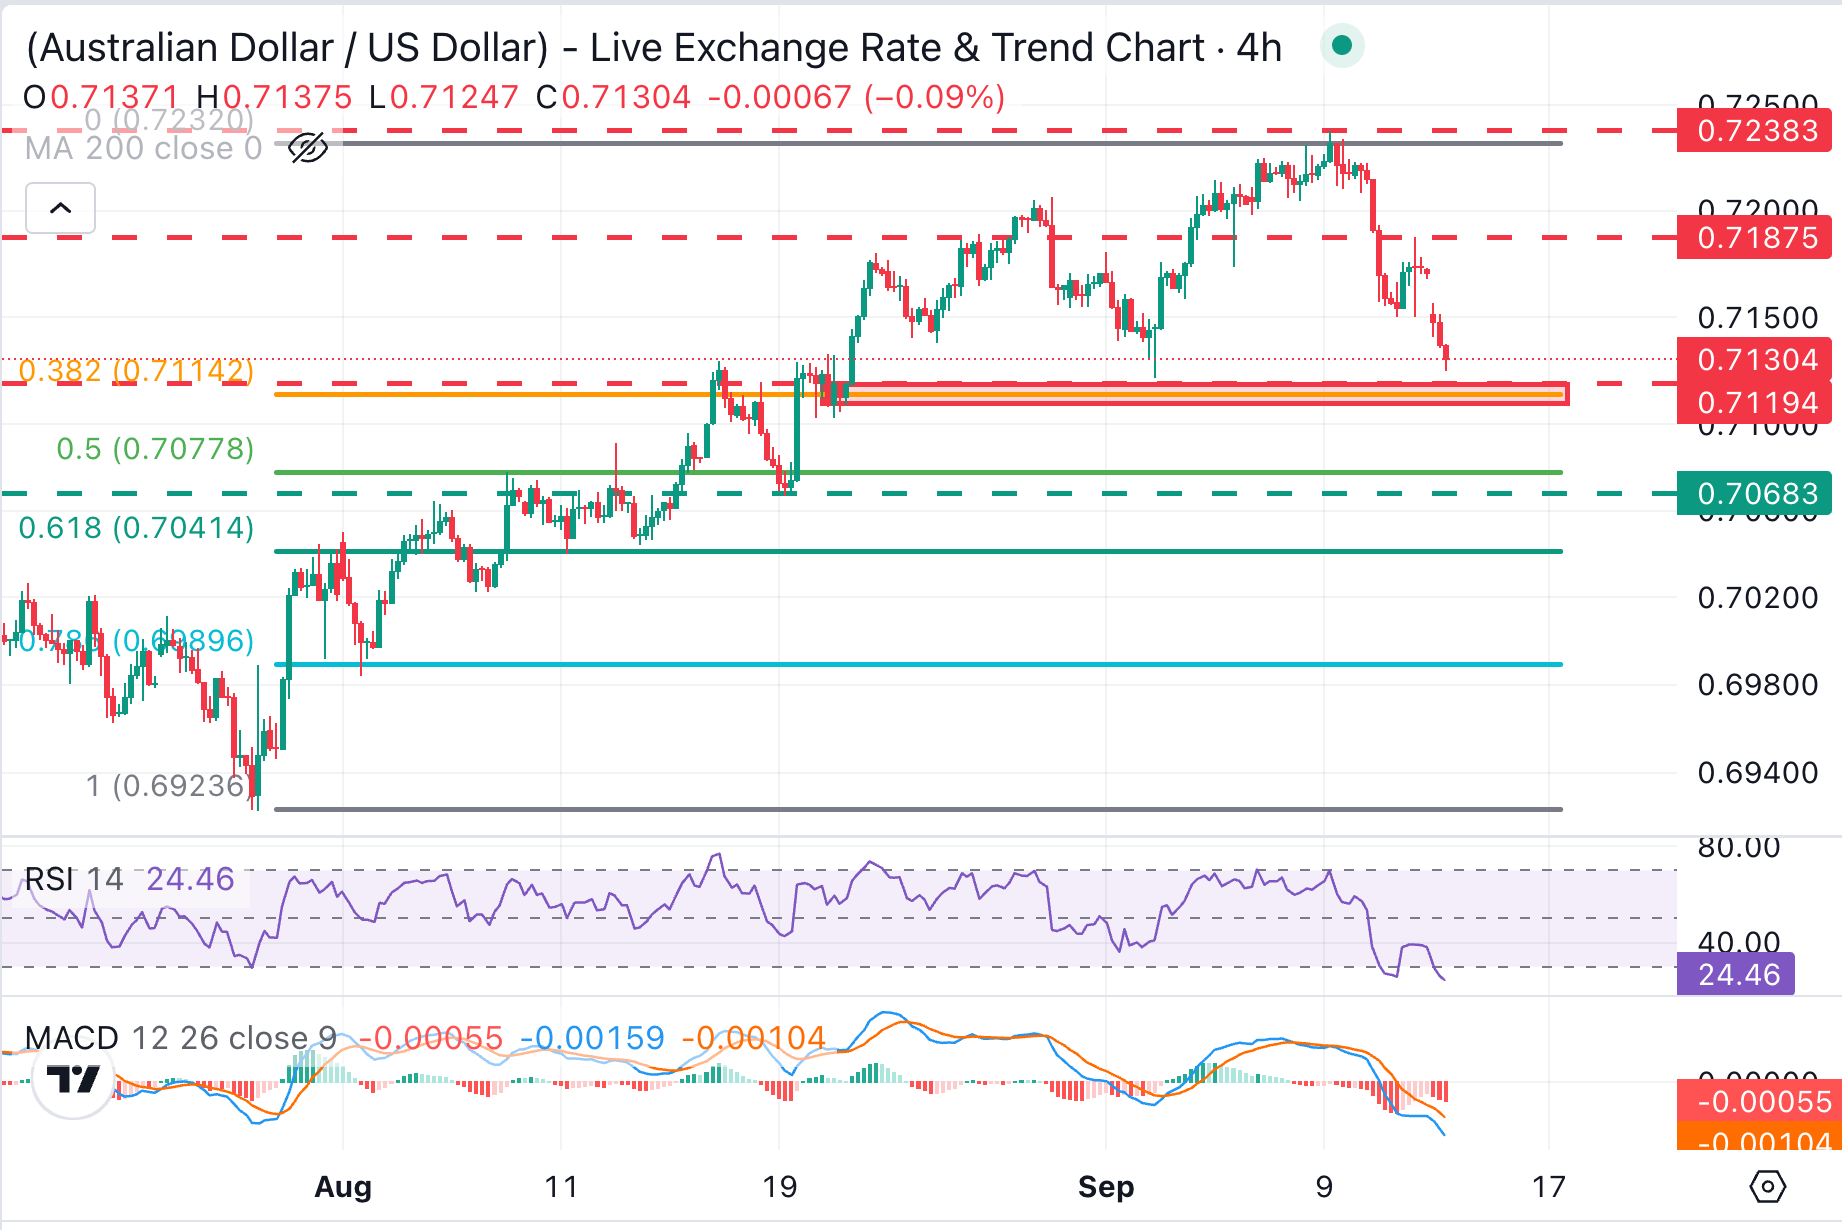
AUD/USD trades at 0.7128, still holding a constructive near-term bias but with a key support level at the 0.7110 area, under pressure. Momentum indicators on intraday charts show growing bearish traction, with the 4-hour Relative Strength Index (14) at slightly oversold levels, and the Moving Average Convergence Divergence (MACD) in negative territory, which suggests that bullish attempts could stay cautious until momentum stabilizes.
The area between the August 20 low at 0.7105 and the September 2 low near 0.7120 is the bottom of the last four weeks' trading range and the 38.6% Fibonacci retracement of the July-September rally. A sustained break of those levels would clear the path towards the August 19 low at the 0.7065 area, and the August 11 and 13 lows near anf the 61.8% Fibonacci retracement around 0.7040.
Bulls, on the other hand, are likely to be tested at Friday's high. of 0.7187, ahead of the mentioned 0.7240 area.
(The technical analysis of this story was written with the help of an AI tool. Know more.)
Australian Dollar Price Today
The table below shows the percentage change of Australian Dollar (AUD) against listed major currencies today. Australian Dollar was the strongest against the New Zealand Dollar.
| USD | EUR | GBP | JPY | CAD | AUD | NZD | CHF | |
|---|---|---|---|---|---|---|---|---|
| USD | 0.47% | 0.23% | 0.63% | 0.14% | 0.56% | 0.70% | 0.16% | |
| EUR | -0.47% | -0.21% | 0.11% | -0.36% | 0.09% | 0.23% | -0.32% | |
| GBP | -0.23% | 0.21% | 0.31% | -0.12% | 0.31% | 0.44% | -0.17% | |
| JPY | -0.63% | -0.11% | -0.31% | -0.48% | -0.04% | 0.07% | -0.51% | |
| CAD | -0.14% | 0.36% | 0.12% | 0.48% | 0.40% | 0.53% | -0.05% | |
| AUD | -0.56% | -0.09% | -0.31% | 0.04% | -0.40% | 0.13% | -0.49% | |
| NZD | -0.70% | -0.23% | -0.44% | -0.07% | -0.53% | -0.13% | -0.61% | |
| CHF | -0.16% | 0.32% | 0.17% | 0.51% | 0.05% | 0.49% | 0.61% |
The heat map shows percentage changes of major currencies against each other. The base currency is picked from the left column, while the quote currency is picked from the top row. For example, if you pick the Australian Dollar from the left column and move along the horizontal line to the US Dollar, the percentage change displayed in the box will represent AUD (base)/USD (quote).
Recommended Articles


