


EUR/GBP Price Forecast: Upside remains capped near 0.8600 as ECB decision looms
- EUR/GBP trades in a narrow range as buyers struggle to extend Tuesday’s rebound.
- Expectations of an ECB rate hike support the Euro, while the BoE is likely to remain on hold.
- The technical outlook stays mildly bullish, although the 100-day SMA limits the immediate upside.
EUR/GBP trades in a narrow range on Wednesday as buyers struggle to extend Tuesday’s rebound. The 100-period Simple Moving Average (SMA) at 0.8599 limits the immediate upside, although momentum indicators retain a modest bullish bias. At the time of writing, the cross trades around 0.8588, little changed on the day.
The fundamental outlook leans to the upside. Markets have fully priced in a 25-basis-point interest rate hike from the European Central Bank (ECB) on Thursday, which would be its second increase this year, after higher Oil prices intensified inflation pressures across the Eurozone. These expectations lend support to the Euro (EUR).
Meanwhile, the Bank of England (BoE) is widely expected to leave borrowing costs unchanged when it meets on September 17, offering little support to the British Pound (GBP). Concerns over the UK’s fiscal position also weigh on sentiment toward the currency.
Analysts at Rabobank acknowledge that “higher oil prices will feed through into more inflation potential,” but note that, “to date, it would appear that Governor Bailey has been confident that the cyclical loosening in the UK labour market means that second-order inflation effects will be avoided and that disinflation will persist.”
Rabobank also highlights that the July 30 policy meeting was “more hawkish than expected,” with “3 members of the MPC voting for an immediate rate rise.” Even so, they argue that “there is a high bar for the doves on the committee to vote for a tightening in policy,” suggesting that a broader shift toward hikes remains unlikely for now.
Technical analysis
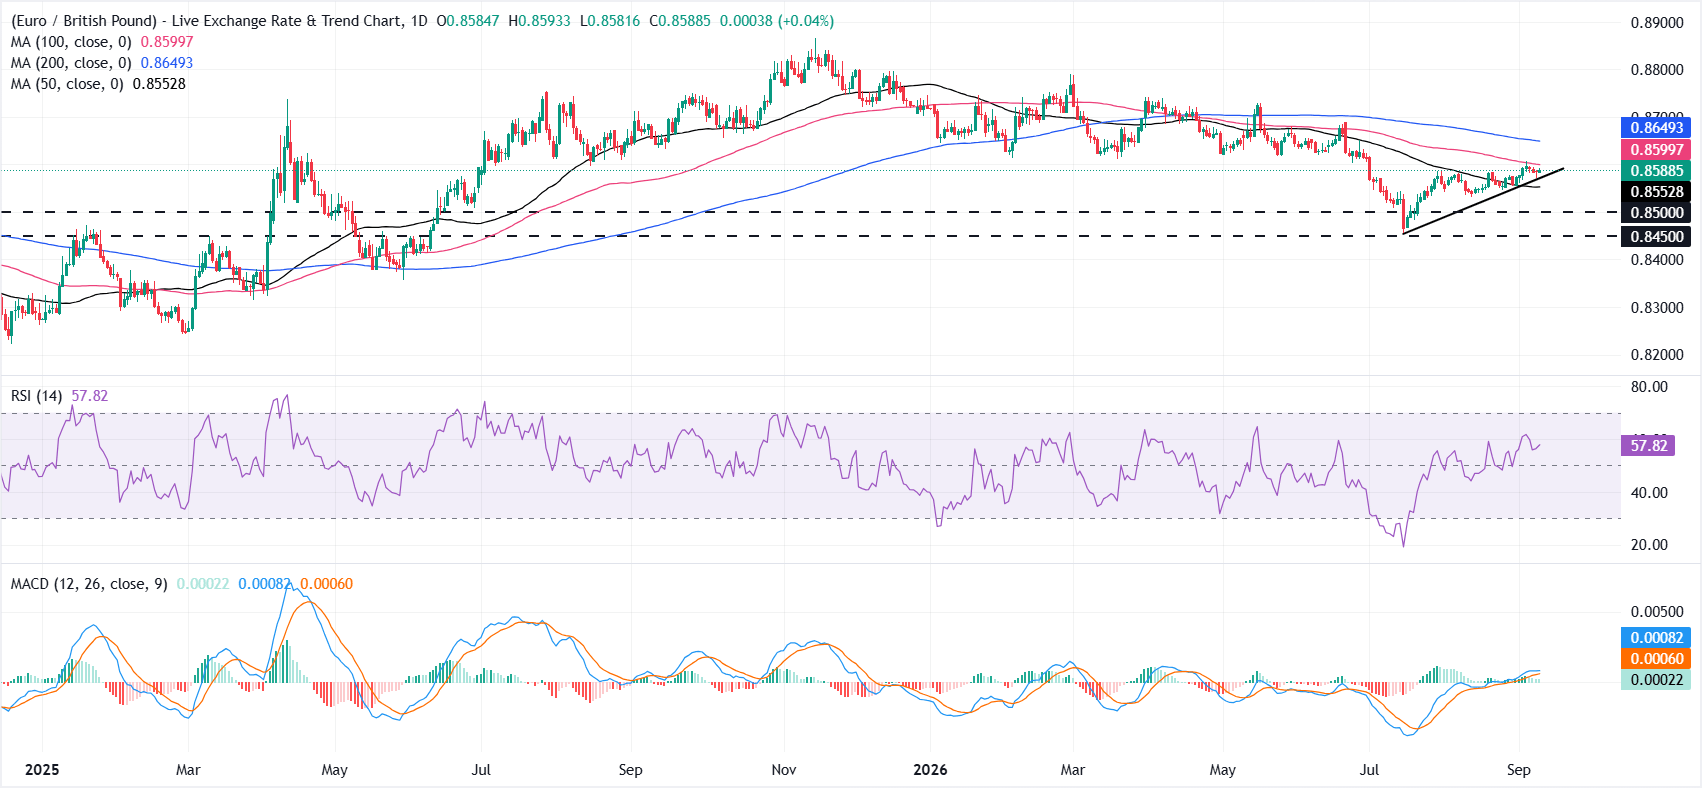
On the daily chart, EUR/GBP holds a mild bullish bias above the rising 50-day Simple Moving Average (SMA) at 0.8553 and the ascending trend-line support near 0.8570. However, the 100-day SMA at 0.8600 and the 200-day SMA at 0.8649 limit the upside. The Relative Strength Index (RSI) stands around 58, indicating positive momentum without overbought conditions, while the Moving Average Convergence Divergence (MACD) histogram remains slightly positive.
A break above the 100-day SMA could bring the 200-day SMA into focus. On the downside, the trend line near 0.8570 offers initial support, followed by the 50-day SMA at 0.8553. A clear move below these levels would expose the 0.8500 and 0.8450 horizontal support levels.
(The technical analysis of this story was written with the help of an AI tool. Know more.)
Euro Price Today
The table below shows the percentage change of Euro (EUR) against listed major currencies today. Euro was the strongest against the New Zealand Dollar.
| USD | EUR | GBP | JPY | CAD | AUD | NZD | CHF | |
|---|---|---|---|---|---|---|---|---|
| USD | -0.20% | -0.17% | -0.51% | -0.10% | -0.08% | 0.04% | -0.25% | |
| EUR | 0.20% | 0.05% | -0.30% | 0.09% | 0.12% | 0.25% | -0.04% | |
| GBP | 0.17% | -0.05% | -0.33% | 0.06% | 0.09% | 0.22% | -0.07% | |
| JPY | 0.51% | 0.30% | 0.33% | 0.40% | 0.43% | 0.52% | 0.27% | |
| CAD | 0.10% | -0.09% | -0.06% | -0.40% | 0.02% | 0.15% | -0.14% | |
| AUD | 0.08% | -0.12% | -0.09% | -0.43% | -0.02% | 0.13% | -0.14% | |
| NZD | -0.04% | -0.25% | -0.22% | -0.52% | -0.15% | -0.13% | -0.27% | |
| CHF | 0.25% | 0.04% | 0.07% | -0.27% | 0.14% | 0.14% | 0.27% |
The heat map shows percentage changes of major currencies against each other. The base currency is picked from the left column, while the quote currency is picked from the top row. For example, if you pick the Euro from the left column and move along the horizontal line to the US Dollar, the percentage change displayed in the box will represent EUR (base)/USD (quote).
Recommended Articles


