

Silver Price Forecasts: XAG/USD remains bullish with dips capped above $67.40

Source Fxstreet
  • XAG/USD’s pullback from the $70.00 area has been contained above $67.40.
  • US PCE inflation figures maintained pressure on the Fed to hike interest rates and provided some support to the USD.
  • Silver bulls remain focused on the key 200-day SMA, around 72.40.

Silver’s (XAG/USD) pullback from the $70.00 area found buyers above $67.40 on Thursday to trim losses and return to the mid-range of the $68.00s during the European morning session. The broader trend remains bullish, with price action steady above previous highs around $67.00, although the cautious market, ahead of the key Jackson Hole Symposium, keeps precious metals trading within range this week. 

The US Dollar received some support on Wednesday, as US Personal Consumption Expenditures (PCE) Price Index figures confirmed that inflation remains sticky, well above the US Federal Reserve's (Fed) 2% target. Bets for a September rate hike, however, remained practically unchanged, at 36%, according to the CME Group’s FedWatch Tool.

Market volatility remains subdued with Investors looking from the sidelines, awaiting Fed Chairman Kevin Warsh’s speech at the Jackson Hole summit, due on Friday. Traders are eager for further insight on the bank’s near-term policy, and his comments are likely to determine the near-term direction for US Dollar crosses and precious metals.

Technical Analysis: Bulls keep looking at the 200-day SMA
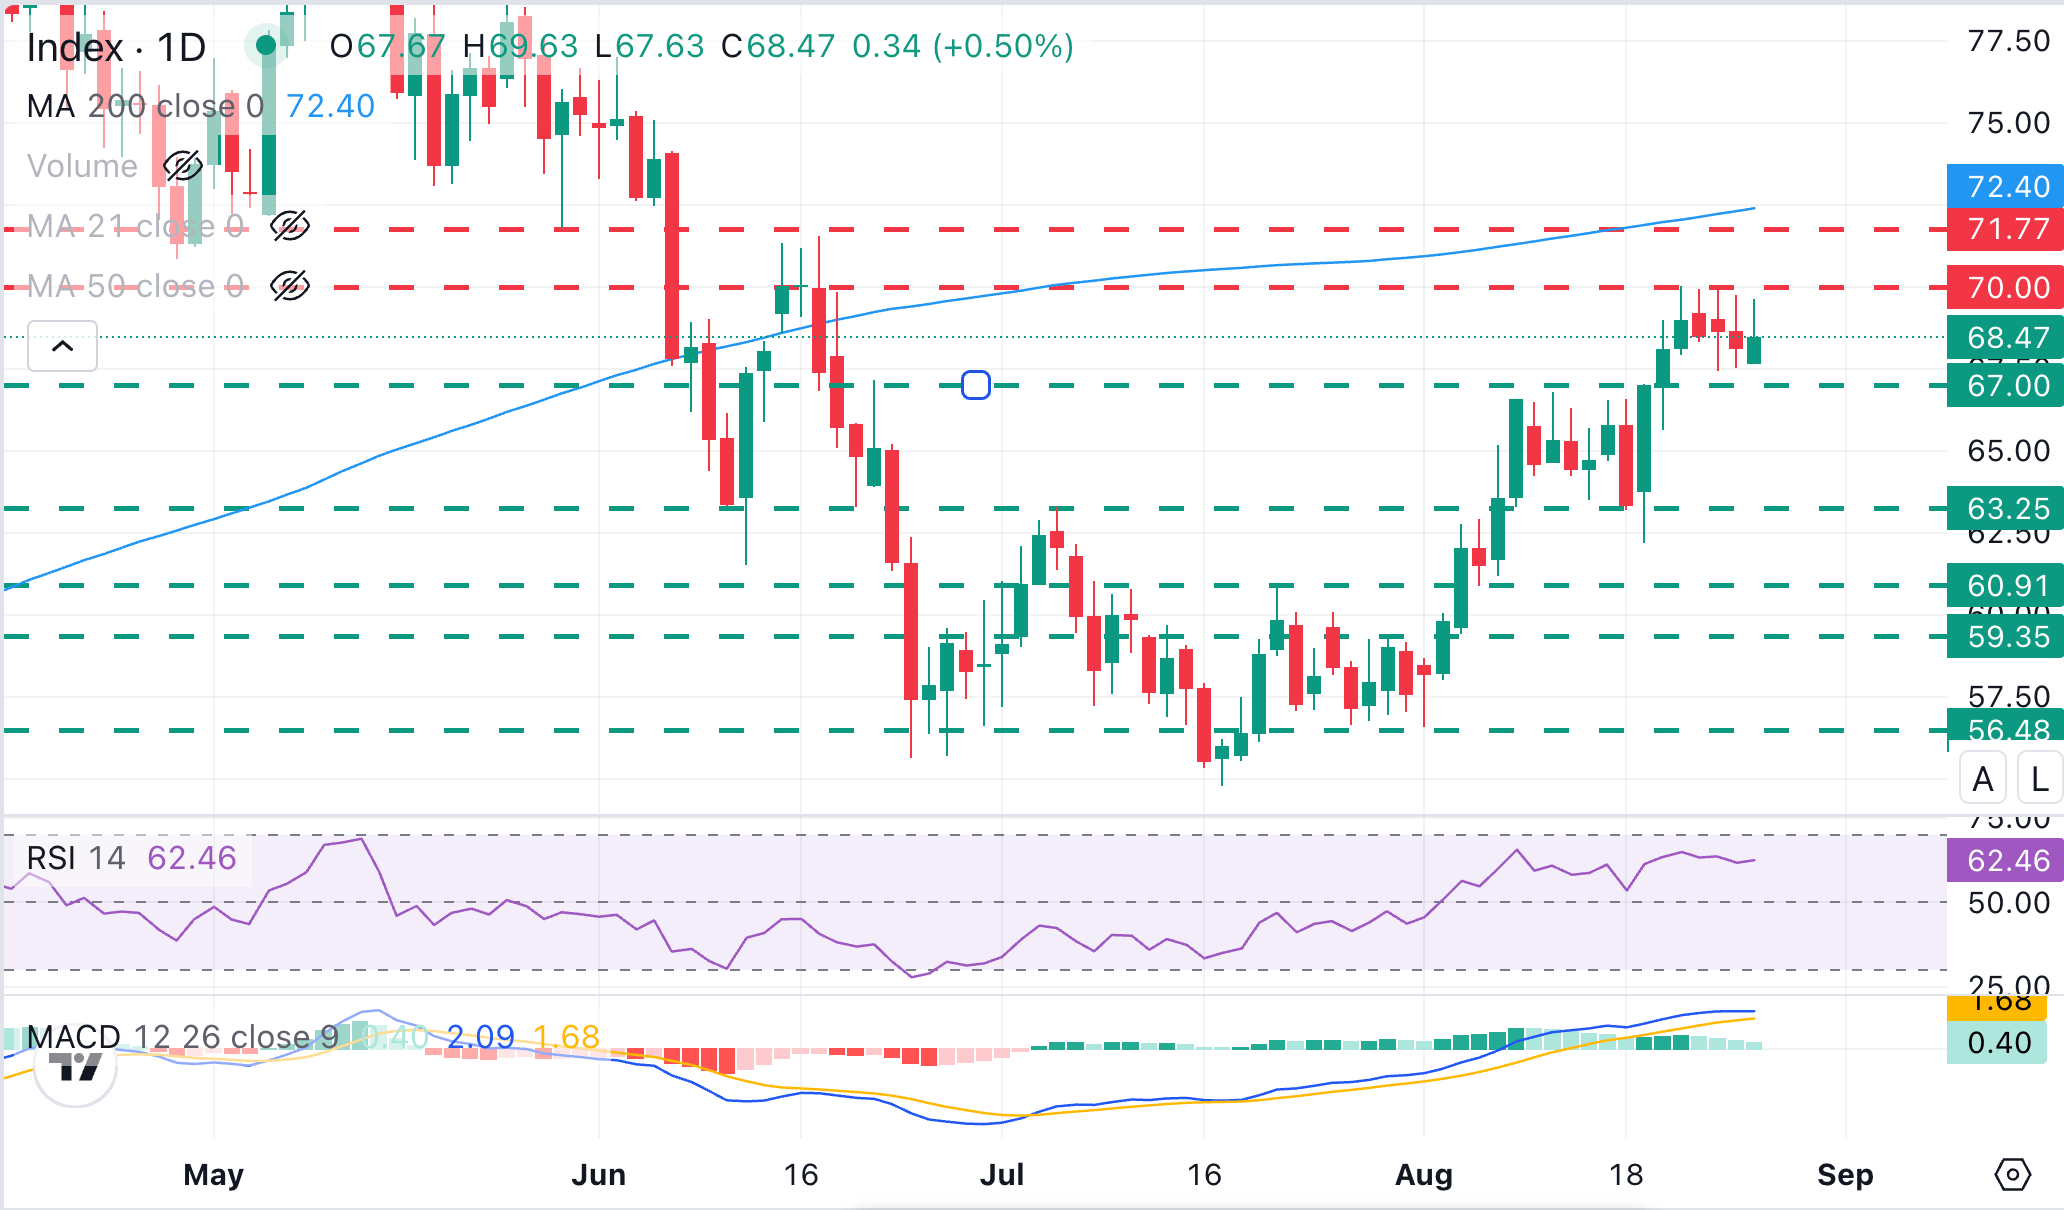
XAG/USD Chart Analysis


XAG/USD maintains the bullish trend from mid July lows below 55.00, with bulls struggling to break resistance at the $70.00 psychological level, focused in the area between the mid-June highs, at $71.55, and the 200-day Simple Moving Average (SMA), a closely watched indicator in FX markets, that is now fluctuating around 72.40

Momentum indicators in daily charts remain bullish, yet highlight a somewhat weaker impulse. The Relative Strength Index (14) near 63 suggests firm but not extreme bullish momentum, while the Moving Average Convergence Divergence (MACD) indicator moderates with a still-positive reading.

On the downside, initial support is seen at the previous resistance area around $67.00 $67.00, followed by a secondary floor at $63.25, which capped bears on August 18, ahead of the August 6 low, near $60.90.

(The technical analysis of this story was written with the help of an AI tool. Know more.)

Disclaimer: For information purposes only. Past performance is not indicative of future results.
placeholder
My Top 5 Stock Market Predictions for 2026Five 2026 market predictions written in a native, news-style voice: AI’s winners and losers, broader sector leadership, dividend demand, valuation cooling as the Shiller CAPE sits at 39 (Dec. 31, 2025), and quantum-computing bursts—while keeping all original facts and numbers unchanged.
Author  Mitrade
Jan 06, Tue
Five 2026 market predictions written in a native, news-style voice: AI’s winners and losers, broader sector leadership, dividend demand, valuation cooling as the Shiller CAPE sits at 39 (Dec. 31, 2025), and quantum-computing bursts—while keeping all original facts and numbers unchanged.
placeholder
Financial Markets 2026: Volatility Catalysts in Gold, Silver, Oil, and Blue-Chip Stocks—A CFD Trader's OutlookGet a comprehensive financial market 2026 outlook exploring key economic drivers, volatility catalysts in gold, oil and stocks, and what the evolving economic outlook means for cfd trading strategies and risk management on global markets.
Author  Rachel Weiss
May 15, Fri
Get a comprehensive financial market 2026 outlook exploring key economic drivers, volatility catalysts in gold, oil and stocks, and what the evolving economic outlook means for cfd trading strategies and risk management on global markets.
placeholder
Gold Price Forecast: US Treasury Yield Slump Pushes Gold Above $4,500, Will Gold Keep Rising?As of the Asian session on August 20, gold prices (XAUUSD) surged again today after breaking above $4,500 on Wednesday, reaching a nearly two-month high of $4,527.12 before pulling back i
Author  TradingKey
Aug 20, Thu
As of the Asian session on August 20, gold prices (XAUUSD) surged again today after breaking above $4,500 on Wednesday, reaching a nearly two-month high of $4,527.12 before pulling back i
placeholder
Crypto Today: Bitcoin, Ethereum, XRP bulls accelerate rally amid rising ETF inflowsThe cryptocurrency market remains bullish on Friday, led by Bitcoin’s (BTC) surge above $77,000. Altcoins, including Ethereum (ETH) and Ripple (XRP), mirror BTC’s positive outlook, trading near $2,400 and $1.35, respectively.
Author  FXStreet
Aug 21, Fri
The cryptocurrency market remains bullish on Friday, led by Bitcoin’s (BTC) surge above $77,000. Altcoins, including Ethereum (ETH) and Ripple (XRP), mirror BTC’s positive outlook, trading near $2,400 and $1.35, respectively.
placeholder
Iran and Oman push talks for ‘interim’ reopening of Hormuz — BloombergIranian Foreign Minister Abbas Araghchi and his Omani counterpart Badr Albusaidi discussed an “interim framework” aimed at resuming shipping through the Strait of Hormuz, Bloomberg reported on Tuesday.
Author  FXStreet
Yesterday 01: 55
Iranian Foreign Minister Abbas Araghchi and his Omani counterpart Badr Albusaidi discussed an “interim framework” aimed at resuming shipping through the Strait of Hormuz, Bloomberg reported on Tuesday.
goTop
quote