EUR/USD remains subdued above 1.0800 ahead of Eurozone, US inflation data

Source Fxstreet
  • EUR/USD holds the 1.0800 support with a focus on inflation readings on both sides of the Atlantic.
  • Eurozone annual HICP is estimated to accelerate while US core PCE is projected to have grown steadily.
  • Eurozone inflation data will impact the ECB’s policy outlook beyond June.

EUR/USD consolidates in a tight range above the round-level support of 1.0800 in Friday’s European session. The price action in the major currency pair is surrounded by uncertainty ahead of the preliminary Eurozone Harmonized Index of Consumer Prices (HICP) data for May and the United States (US) core Personal Consumption Expenditure Price Index (PCE) data for April, which will be published at 09:00 GMT and 12:30 GMT, respectively.

Eurozone annual headline HICP data is forecasted to have grown at a higher pace of 2.5% from 2.4% in April. In the same period, the core HICP data – which excludes volatile components such as food, energy, alcohol and tobacco – is estimated to have accelerated to 2.8% from the prior reading of 2.7%. 

Eurozone inflation data for May isn’t likely to impact market speculation for European Central Bank (ECB) rate cuts in the June meeting as it appears to be a done deal. ECB policymakers have remained comfortable with rate-cut speculation for June due to consistently easing price pressures and resumed progress in service disinflation.

However, the inflation data will provide cues about how the ECB will follow the rate-cut path beyond June. A further decline in price pressures would prompt expectations of subsequent rate cuts, while a stubborn reading could force officials to adopt a more gradual approach. Meanwhile, the majority of ECB policymakers have been emphasizing the need to remain data-dependent and have been reluctant to offer any pre-defined rate trajectory.

Daily digest market movers: EUR/USD remains subdued ahead of Eurozone, US inflation data

  • EUR/USD is poised for volatility in Friday’s European and American sessions as the inflation data is scheduled to be published. In the US, the Bureau of Economic Analysis (BEA) will report the core PCE Inflation data for April, which is the Federal Reserve’s (Fed) preferred inflation gauge.
  • Core PCE inflation is projected to have grown steadily by 0.3% and 2.8% on monthly and annual basis, respectively. Steady or hot inflation reading would likely prompt traders to pare Fed rate-cut bets for the September meeting, while soft figures would do the opposite. 
  • Currently, the CME FedWatch tool reflects that traders are indecisive about the US central bank reducing interest rates in the September meeting. The reason behind this deepening uncertainty is the strong labor market outlook and upside risks to inflation.
  • Fed policymakers emphasize the need to maintain interest rates at their current levels for long until they get sufficient evidence that price pressures will sustainably return to the desired rate of 2%. Officials worry that the progress in the disinflation process has stalled  even though the April’s Consumer Price Index (CPI) report showed that price pressures abated.
  • Meanwhile, the US Dollar Index (DXY), which tracks the Greenback’s value against six major currencies, is slightly up near 104.85. The USD Index gains ground after correcting sharply on Thursday. The sell-off move was driven by slower United States Q1 Gross Domestic Product (GDP) growth. the revised GDP estimates report showed that the economy expanded at a slower pace of 1.3% against the 1.6% initially estimated.

Technical Analysis: EUR/USD strives to maintain firm footing above 1.0800

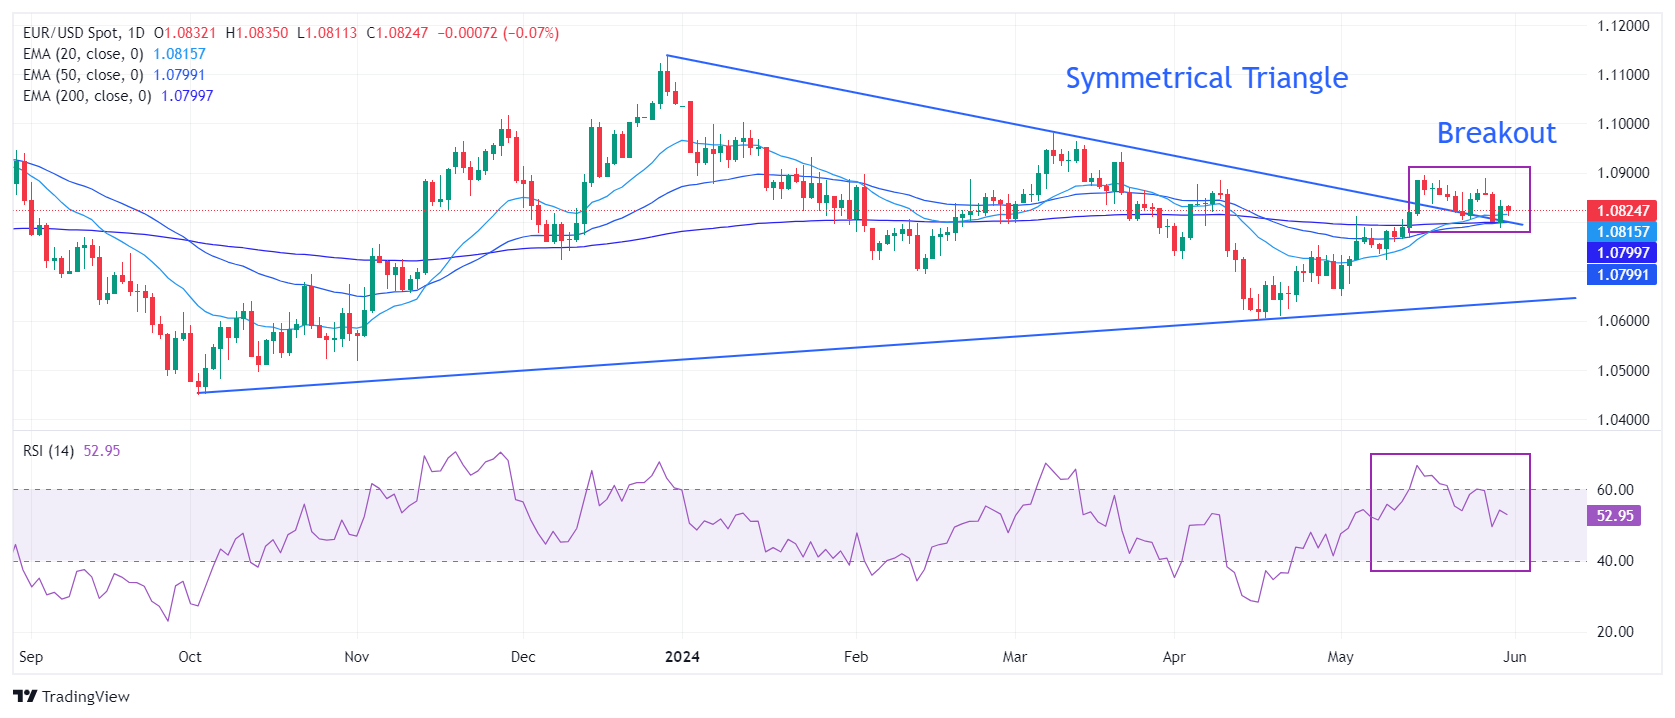
EUR/USD edges down but holds the crucial support of 1.0800 ahead of US core PCE inflation data. The shared currency pair holds the breakout of the Symmetrical Triangle chart pattern formed on a daily time frame, which is in the region of 1.0800. The near-term outlook of the shared currency pair remains uncertain as it struggles to sustain above all short-to-long-term Exponential Moving Averages (EMAs).

The 14-period Relative Strength Index (RSI) has slipped into the 40.00-60.00 range, suggesting that the momentum, which was leaned toward the upside, has faded for now.

The major currency pair would strengthen if it recaptures a two-month high around 1.0900. A decisive break above this level would drive the asset towards the March 21 high, around 1.0950, and the psychological resistance of 1.1000. However, a downside move below the 200-day EMA at 1.0800 could push it further down.

Euro FAQs

The Euro is the currency for the 20 European Union countries that belong to the Eurozone. It is the second most heavily traded currency in the world behind the US Dollar. In 2022, it accounted for 31% of all foreign exchange transactions, with an average daily turnover of over $2.2 trillion a day. EUR/USD is the most heavily traded currency pair in the world, accounting for an estimated 30% off all transactions, followed by EUR/JPY (4%), EUR/GBP (3%) and EUR/AUD (2%).

The European Central Bank (ECB) in Frankfurt, Germany, is the reserve bank for the Eurozone. The ECB sets interest rates and manages monetary policy. The ECB’s primary mandate is to maintain price stability, which means either controlling inflation or stimulating growth. Its primary tool is the raising or lowering of interest rates. Relatively high interest rates – or the expectation of higher rates – will usually benefit the Euro and vice versa. The ECB Governing Council makes monetary policy decisions at meetings held eight times a year. Decisions are made by heads of the Eurozone national banks and six permanent members, including the President of the ECB, Christine Lagarde.

Eurozone inflation data, measured by the Harmonized Index of Consumer Prices (HICP), is an important econometric for the Euro. If inflation rises more than expected, especially if above the ECB’s 2% target, it obliges the ECB to raise interest rates to bring it back under control. Relatively high interest rates compared to its counterparts will usually benefit the Euro, as it makes the region more attractive as a place for global investors to park their money.

Data releases gauge the health of the economy and can impact on the Euro. Indicators such as GDP, Manufacturing and Services PMIs, employment, and consumer sentiment surveys can all influence the direction of the single currency. A strong economy is good for the Euro. Not only does it attract more foreign investment but it may encourage the ECB to put up interest rates, which will directly strengthen the Euro. Otherwise, if economic data is weak, the Euro is likely to fall. Economic data for the four largest economies in the euro area (Germany, France, Italy and Spain) are especially significant, as they account for 75% of the Eurozone’s economy.

Another significant data release for the Euro is the Trade Balance. This indicator measures the difference between what a country earns from its exports and what it spends on imports over a given period. If a country produces highly sought after exports then its currency will gain in value purely from the extra demand created from foreign buyers seeking to purchase these goods. Therefore, a positive net Trade Balance strengthens a currency and vice versa for a negative balance.


Disclaimer: For information purposes only. Past performance is not indicative of future results.
placeholder
Gold Price Forecast: XAU/USD drifts higher above $4,200 as Fed delivers expected cutGold price (XAU/USD) gains momentum to around $4,235 during the early Asian session on Thursday. The precious metal extends its upside after the US Federal Reserve (Fed) delivered an expected third consecutive interest rate cut and maintained its outlook for just one cut in 2026.
Author  FXStreet
Dec 11, Thu
Gold price (XAU/USD) gains momentum to around $4,235 during the early Asian session on Thursday. The precious metal extends its upside after the US Federal Reserve (Fed) delivered an expected third consecutive interest rate cut and maintained its outlook for just one cut in 2026.
placeholder
Ethereum Price Slips Lower — $3,000 Looms as the Key BattlegroundEthereum is attempting to recover from a $3,026 low but remains below $3,200 and the 100-hour SMA, with a bearish trend line near $3,175 capping rebounds as bulls need a clean break above $3,200 to target $3,250–$3,400, while a drop below $3,050 risks a retest of $3,000 and $2,940.
Author  Mitrade
Dec 15, Mon
Ethereum is attempting to recover from a $3,026 low but remains below $3,200 and the 100-hour SMA, with a bearish trend line near $3,175 capping rebounds as bulls need a clean break above $3,200 to target $3,250–$3,400, while a drop below $3,050 risks a retest of $3,000 and $2,940.
placeholder
Bitcoin Slides 5% as Sellers Lean In — Can BTC Reclaim $88,000?Bitcoin has dropped back below $88,000 after rolling over from $90,500, with price still trading under the 100-hour Simple Moving Average. The sell-off found a floor at $85,151, and BTC is now consolidating near that base, but rebounds are facing pressure from a bearish trend line around $89,000. Bulls need to retake $88,000–$89,000 to ease downside risk; failure to do so keeps $85,500–$85,000 and then $83,500 in play, with $80,000 as the deeper “line in the sand.” Bitcoin (BTC) is back in damage-control mode after a sharp pullback wiped out recent gains. The price failed to reclaim the $90,000–$90,500 band, rolled over, and slid through $88,500 before briefly dipping under $87,000. Buyers did show up around $85,000, but the rebound so far looks more like stabilization than a clear trend reversal. Bitcoin dips hard, finds a bid near $85,000(h3) BTC’s latest move lower began when it couldn’t build follow-through above $90,000 and $90,500. Once that upside stalled, sellers took control and pushed price down through $88,500. The slide accelerated enough to spike below $87,000, but the market didn’t free-fall. Bulls defended the $85,000 zone, printing a low at $85,151. Since then, Bitcoin has been consolidating below the 23.6% Fibonacci retracement of the drop from the $93,560 swing high to the $85,151 low — a clue that the bounce is still shallow and that sellers haven’t fully backed off yet. Structurally, BTC is still on the back foot: It’s trading below $88,000, and It remains below the 100-hour Simple Moving Average, keeping short-term trend pressure pointed downward. Resistance is layered, and $89,000 is the problem area(h3) If bulls try to turn this into a recovery, they’ll have to climb through multiple ceilings in quick succession. First, BTC faces resistance around $87,150, followed by a more meaningful barrier near $87,500. From there, the market’s attention snaps back to $88,000 — the level BTC just lost and now needs to reclaim. A close back above $88,000 would improve the tone, but it doesn’t solve the bigger issue: there’s a bearish trend line on the hourly BTC/USD chart (Kraken feed) with resistance near $89,000, which also lines up with the next technical hurdle. If BTC can push through $89,000 and hold, the rebound could extend toward $90,000, with follow-through targets at $91,000 and $91,500. But until price clears that $88,000–$89,000 zone, rallies are at risk of being sold rather than chased. If BTC fails to reclaim resistance, the downside path is clear(h3) The near-term bear case is simple: if Bitcoin can’t climb back above the $87,000 area and keep traction, sellers may attempt another leg lower. Support levels line up like this: Immediate support: $85,500 First major support: $85,000 Next support: $83,500 Then $82,500 in the near term Below that, the major “don’t break this” level is still $80,000. If BTC slips under $80,000, the risk of acceleration to the downside increases significantly — not because it’s magic, but because it’s the kind of psychological and structural level that tends to trigger forced de-risking. Indicators: momentum still leans bearish(h3) The intraday indicators aren’t offering much comfort yet: Hourly MACD is losing pace in the bearish zone. Hourly RSI remains below 50, suggesting sellers still have the upper hand on short timeframes. So while the $85,000 defense held for now, the market hasn’t flipped bullish — it’s just stopped bleeding.
Author  Mitrade
Dec 16, Tue
Bitcoin has dropped back below $88,000 after rolling over from $90,500, with price still trading under the 100-hour Simple Moving Average. The sell-off found a floor at $85,151, and BTC is now consolidating near that base, but rebounds are facing pressure from a bearish trend line around $89,000. Bulls need to retake $88,000–$89,000 to ease downside risk; failure to do so keeps $85,500–$85,000 and then $83,500 in play, with $80,000 as the deeper “line in the sand.” Bitcoin (BTC) is back in damage-control mode after a sharp pullback wiped out recent gains. The price failed to reclaim the $90,000–$90,500 band, rolled over, and slid through $88,500 before briefly dipping under $87,000. Buyers did show up around $85,000, but the rebound so far looks more like stabilization than a clear trend reversal. Bitcoin dips hard, finds a bid near $85,000(h3) BTC’s latest move lower began when it couldn’t build follow-through above $90,000 and $90,500. Once that upside stalled, sellers took control and pushed price down through $88,500. The slide accelerated enough to spike below $87,000, but the market didn’t free-fall. Bulls defended the $85,000 zone, printing a low at $85,151. Since then, Bitcoin has been consolidating below the 23.6% Fibonacci retracement of the drop from the $93,560 swing high to the $85,151 low — a clue that the bounce is still shallow and that sellers haven’t fully backed off yet. Structurally, BTC is still on the back foot: It’s trading below $88,000, and It remains below the 100-hour Simple Moving Average, keeping short-term trend pressure pointed downward. Resistance is layered, and $89,000 is the problem area(h3) If bulls try to turn this into a recovery, they’ll have to climb through multiple ceilings in quick succession. First, BTC faces resistance around $87,150, followed by a more meaningful barrier near $87,500. From there, the market’s attention snaps back to $88,000 — the level BTC just lost and now needs to reclaim. A close back above $88,000 would improve the tone, but it doesn’t solve the bigger issue: there’s a bearish trend line on the hourly BTC/USD chart (Kraken feed) with resistance near $89,000, which also lines up with the next technical hurdle. If BTC can push through $89,000 and hold, the rebound could extend toward $90,000, with follow-through targets at $91,000 and $91,500. But until price clears that $88,000–$89,000 zone, rallies are at risk of being sold rather than chased. If BTC fails to reclaim resistance, the downside path is clear(h3) The near-term bear case is simple: if Bitcoin can’t climb back above the $87,000 area and keep traction, sellers may attempt another leg lower. Support levels line up like this: Immediate support: $85,500 First major support: $85,000 Next support: $83,500 Then $82,500 in the near term Below that, the major “don’t break this” level is still $80,000. If BTC slips under $80,000, the risk of acceleration to the downside increases significantly — not because it’s magic, but because it’s the kind of psychological and structural level that tends to trigger forced de-risking. Indicators: momentum still leans bearish(h3) The intraday indicators aren’t offering much comfort yet: Hourly MACD is losing pace in the bearish zone. Hourly RSI remains below 50, suggesting sellers still have the upper hand on short timeframes. So while the $85,000 defense held for now, the market hasn’t flipped bullish — it’s just stopped bleeding.
placeholder
December Santa Claus Rally: New highs in sight for US and European stocks?Historical data show a rising trend of US and European stocks in December. If the momentum is strong, fund managers may rush in with a buying frenzy.
Author  Mitrade
Yesterday 02: 50
Historical data show a rising trend of US and European stocks in December. If the momentum is strong, fund managers may rush in with a buying frenzy.
placeholder
XRP’s Price Action Flashes a Warning Even as ETF Flows Stay PositiveXRP’s structure remains weak despite 18 straight positive closes in spot XRP ETFs, with analysts warning that $1.98 and other nearby resistance zones could cap rebounds unless the YO region is reclaimed, while deeper downside scenarios keep $1.53 on watch as a potential (not guaranteed) accumulation area.
Author  Mitrade
22 hours ago
XRP’s structure remains weak despite 18 straight positive closes in spot XRP ETFs, with analysts warning that $1.98 and other nearby resistance zones could cap rebounds unless the YO region is reclaimed, while deeper downside scenarios keep $1.53 on watch as a potential (not guaranteed) accumulation area.
goTop
quote