


Oracle Corp Stock (ORCL) Moved Down by 3.51% on Oct 29: Key Drivers Unveiled
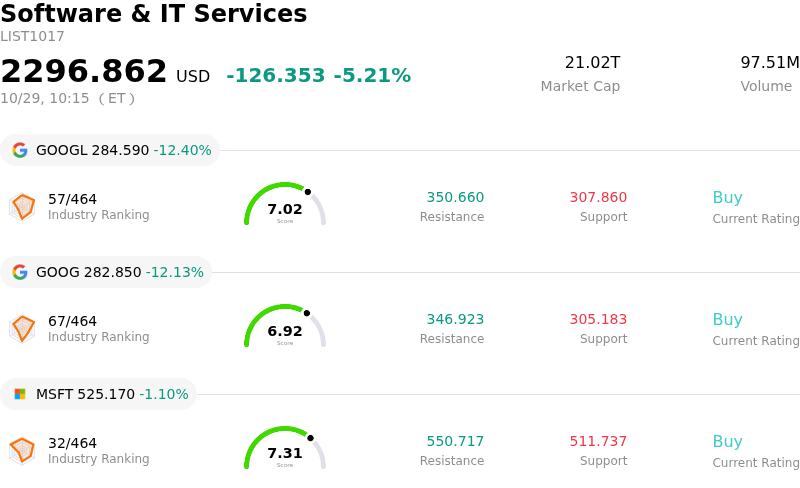
Oracle Corp (ORCL) moved down by 3.51%. The Software & IT Services sector is down by 5.21%. The company outperformed the industry. Top 3 stocks by turnover in the sector: Alphabet Inc Class A (GOOGL) down 12.36%; Alphabet Inc Class C (GOOG) down 12.09%; Microsoft Corp (MSFT) down 1.04%.
What is driving Oracle Corp (ORCL)’s stock price down today?
Oracle Corporation experienced downward pressure and heightened intraday volatility as investors engaged in profit-taking and portfolio rebalancing following a substantial rally in the preceding session. The pullback represents a natural market consolidation after the initial enthusiasm surrounding the company's 2026 Investor Day. While management outlined ambitious long-term revenue targets and established a defined timeline to return to positive free cash flow by fiscal 2028, market participants rapidly digested the news, choosing to lock in short-term gains amid ongoing macroeconomic uncertainty.
Broader enterprise software and mega-cap technology sentiment also contributed to the underlying weakness. Earnings reports and updated guidance from major peer companies renewed market scrutiny over massive artificial intelligence capital expenditures and elevated corporate leverage. As investors re-evaluated the timeline required for AI infrastructure investments to yield sustainable free cash flow returns, caution re-emerged across the broader cloud and high-beta technology sectors, triggering institutional profit extraction.
From an investment strategy standpoint, the intraday volatility highlights the ongoing tug-of-war between strong structural demand and near-term execution realities. Although Oracle's expanding contracted backlog, silicon plurality agreements, and enterprise partnerships support its position in cloud infrastructure, the heavy upfront capital expenditure requirements through fiscal 2028 keep the equity exposed to sentiment swings. Near-term share price performance will likely remain anchored to broader technology sector momentum, interest rate expectations, and market confidence in management's ability to maintain margin discipline while funding multi-gigawatt cloud expansions.
Technical Analysis of Oracle Corp (ORCL)
Technically, Oracle Corp (ORCL) shows a MACD (12,26,9) value of 2.411, indicating a neutral signal. The RSI at 53.477 suggests neutral condition and the Williams %R at 32.582 suggests buy condition. Please monitor closely.
Media Coverage of Oracle Corp (ORCL)
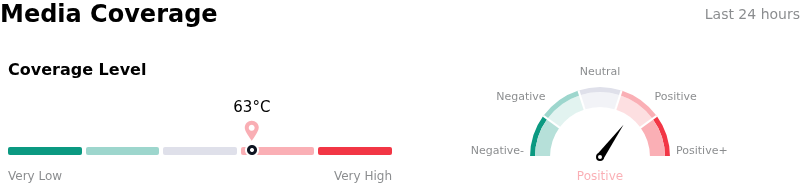
In terms of media coverage, Oracle Corp (ORCL) shows a coverage score of 63, indicating a high level of media attention. The overall market sentiment index is currently in bullish zone.
Fundamental Analysis of Oracle Corp (ORCL)
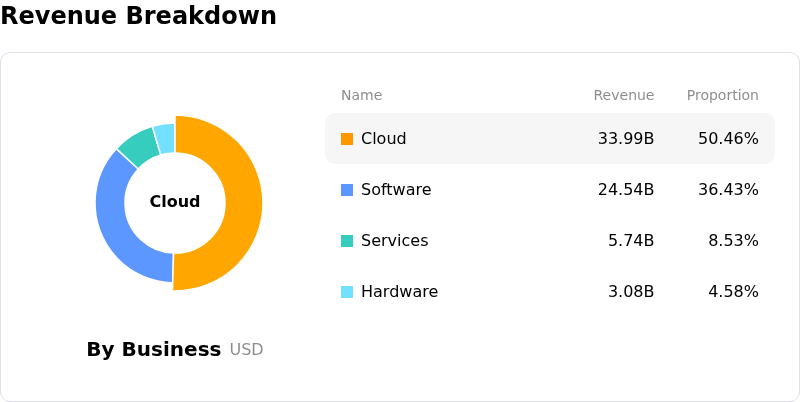
Oracle Corp (ORCL) is in the Software & IT Services industry. Its latest annual revenue is $67.36B, ranking 8 in the industry. The net profit is $16.98B, ranking 6 in the industry. Company Profile
Over the past month, multiple analysts have rated the company as Buy, with an average price target of $240.38, a high of $330.00, and a low of $110.00.
More details about Oracle Corp (ORCL)
Company Specific Risks:
- High Capital Expenditure and Delayed Cash Flow Recovery: Planned capital expenditures of $90 billion to $95 billion for fiscal 2027 continue to strain liquidity, keeping free cash flow in negative territory and delaying positive cash flow conversion until the second half of fiscal 2028.
- Extreme Backlog Customer Concentration: Nearly half of Oracle's $664 billion remaining performance obligation backlog remains concentrated with a single customer, OpenAI, creating acute downside risk if OpenAI experiences funding delays, operational disruptions, or strategic re-evaluations.
- Elevated Debt Burden and Credit Downgrade Pressure: Carrying approximately $169 billion in total debt and lease obligations, Oracle faces elevated debt-servicing costs and balance sheet stress following S&P's credit rating downgrade to BBB—just one notch above speculative grade.
- Fiscal 2027 Earnings Guidance Shortfall: Reaffirmed fiscal 2027 earnings per share guidance of $8.10 fell below consensus Wall Street expectations of $8.14, prompting analyst price target trims from firms such as Wells Fargo and Scotiabank due to capex funding concerns.
Recommended Articles


