


Platinum (XPTUSD) Is down 2.06% on Oct 29: What Is Driving the Move?
Platinum (XPTUSD) is down 2.06% at Oct 29 03:50(ET), now at $1508.26, with a 7-day down of 3.66%.
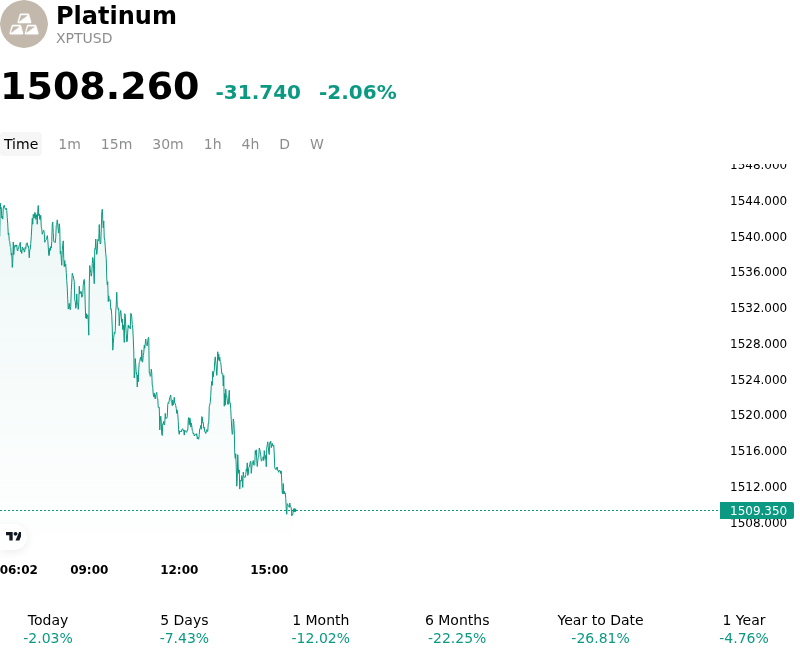
What is driving Platinum (XPTUSD)’s stock price down today?
The pullback in spot platinum reflects a confluence of macroeconomic headwinds, shifting industrial demand expectations, and technical de-risking across the precious metals complex. Persistent strength in the U.S. dollar, alongside elevated benchmark real yields, has increased the opportunity cost of holding non-yielding hard assets. Market participants have recalibrated expectations around central bank monetary policy, driving risk-averse positioning that hit cyclical and industrial-heavy metals particularly hard. A firmer greenback has further diminished cross-border physical purchasing power, restricting institutional capital inflows into spot metal contracts.
Beyond overarching macroeconomic pressure, fundamental demand concerns continue to weigh on market sentiment. As a metal with significant exposure to automotive catalyst manufacturing and broad industrial applications, platinum remains vulnerable to signs of slowing global industrial momentum. Decelerating light-vehicle production figures and expanding market penetration of zero-emission battery electric vehicles have prompted investors to downgrade mid-term autocatalyst consumption expectations. Softness in key physical markets, notably reduced jewelry and industrial fabrication demand in major Asian consumption centers, has added further structural drag to global demand forecasts.
The fundamental landscape has also experienced a broader repricing as tight-market narratives give way to projections of an improving supply balance. While primary mining output in top producing regions remains constrained by structural power and operational bottlenecks, the gradual release of accumulated refined metal inventories and easing physical tightness have muted supply-side risk premiums.
From a positioning standpoint, the breach of key technical support zones triggered automated stop-loss execution and institutional long liquidation. Systematic macro funds and speculative accounts unwound bullish exposure as momentum indicators deteriorated, amplifying downside price movement. Investors continue to monitor upcoming central bank interest rate decisions, global economic activity indicators, and vehicle manufacturing data for signs of stabilization in physical market balances.
Technical Analysis of Platinum (XPTUSD)
Technically, Platinum (XPTUSD) shows a MACD (12,26,9) value of -18.741, indicating a sell signal. The RSI at 30.299 suggests neutral condition and the Williams %R at 91.093 suggests oversold condition. Please monitor closely.
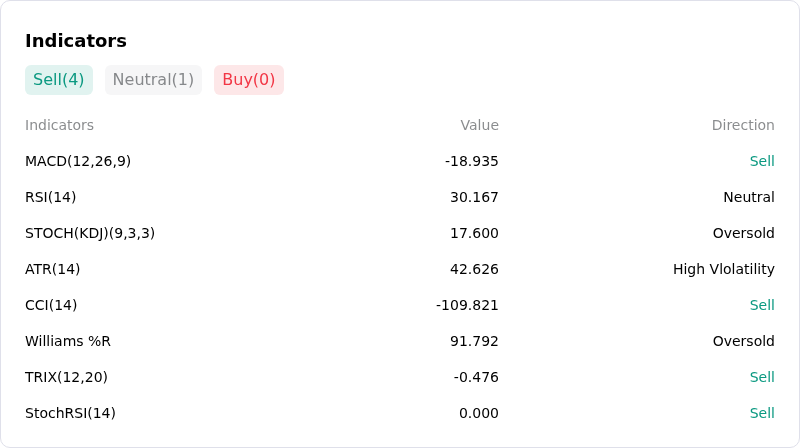
More details about Platinum (XPTUSD)
Recent Events and Risks:
- WPIC Reversal to Market Surplus: The World Platinum Investment Council revised its full-year balance forecast from a projected supply deficit to a 265,000-ounce surplus, creating severe overhead price resistance and triggering technical sell-offs across spot XPTUSD.
- Accelerating ETF Disinvestment and Stock Unwinds: Persistent institutional profit-taking and ETF liquidations exceeding 380,000 ounces—combined with CME exchange-stock drawdowns—have injected substantial physical liquidity back into spot markets, unwinding prior tightness and driving downside intraday momentum.
- Deteriorating Automotive and Asian Jewelry Demand: Automotive autocatalyst platinum consumption remains under pressure from sluggish vehicle production, while Chinese platinum jewelry demand contracted sharply by 15% year-over-year amid weak regional consumer spending and price sensitivity.
- Macro Pressure from Real Yields and Dollar Strength: Elevated U.S. 10-year real yields combined with a resilient U.S. dollar continue to elevate the opportunity cost of holding non-yielding precious metals, exposing XPTUSD to risk-off liquidity stress and breakdown below technical support levels.
Recommended Articles


