


Silver/AUD (XAGAUD) Is down 2.08% on Oct 29: Why It Happened
Silver/AUD (XAGAUD) is down 2.08% at Oct 29 02:10(ET), now at $74.879, with a 7-day down of 3.65%.
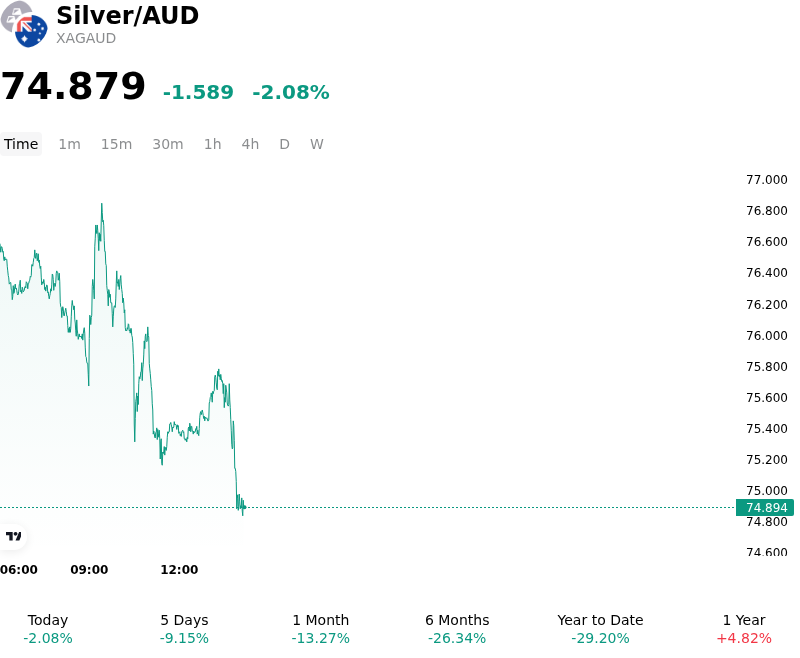
What is driving Silver/AUD (XAGAUD)’s stock price down today?
The downside pressure on Australian dollar-denominated silver was primarily driven by a significant rally in the Australian dollar, alongside broader weakness in global spot precious metals. A primary catalyst was the release of Australia's latest inflation report, which revealed that third-quarter underlying Consumer Price Index data tracked above market consensus and central bank projections. This hotter-than-expected inflation print forced a swift repricing in interest rate expectations, sharply elevating market probabilities for an imminent rate hike by the Reserve Bank of Australia. The resulting surge in domestic bond yields provided strong fundamental support for the Australian dollar, exerting direct downward pressure on localized silver prices due to cross-currency exchange dynamics.
At the same time, global dollar-denominated silver faced persistent headwinds following the U.S. Federal Reserve's monetary policy update. By holding borrowing costs steady while highlighting ongoing inflation risks driven by elevated energy prices, the central bank tempered expectations for near-term monetary easing. Elevated real interest rate expectations maintained upward pressure on opportunity costs, diminishing investor demand for non-interest-bearing bullion. Additionally, cautious sentiment surrounding global industrial activity weighed on silver's dual role as both an industrial input and a safe-haven asset, encouraging institutional capital to reduce exposure.
The convergence of a stronger Australian currency and weakening global spot bullion prices created a compounding negative effect for Australian dollar-denominated silver. Institutional positioning shifted rapidly as traders adjusted portfolios to reflect a more hawkish Reserve Bank of Australia against a backdrop of constrained global precious metal momentum. Looking ahead, institutional investors continue to monitor central bank policy guidance, energy-driven inflation dynamics, and physical inventory trends to assess whether current price adjustments represent a short-term currency-driven repricing or the start of a broader structural shift in industrial metal demand.
Technical Analysis of Silver/AUD (XAGAUD)
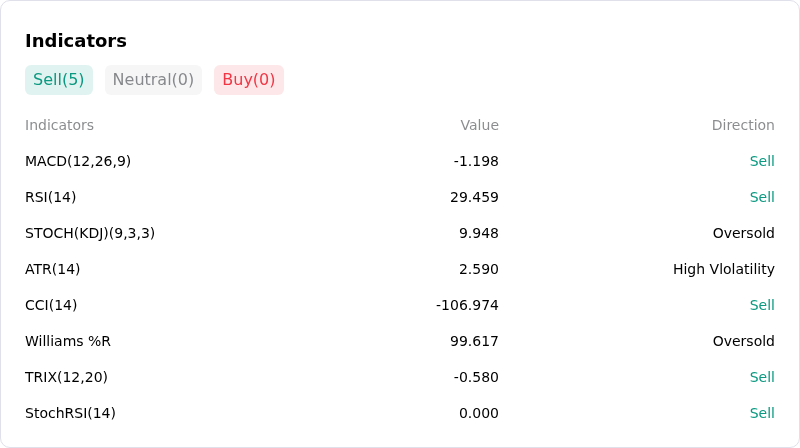
Technically, Silver/AUD (XAGAUD) shows a MACD (12,26,9) value of -1.198, indicating a sell signal. The RSI at 29.459 suggests sell condition and the Williams %R at 99.617 suggests oversold condition. Please monitor closely.
More details about Silver/AUD (XAGAUD)
Recent Events and Risks:
- Hawkish Monetary Policy and Elevated Real Yields: Persistent inflation concerns, elevated benchmark bond yields, and market expectations that the Federal Reserve will maintain high interest rates have boosted global real yields, increasing the opportunity cost of holding non-yielding precious metals and triggering institutional capital outflows from spot silver.
- Contraction in Solar Photovoltaic and Industrial Demand: Industry updates from the Silver Institute indicate a projected ~19% year-over-year decline in silver consumption within the photovoltaic solar panel sector—the largest annual drop on record—driven by technology thrifting and slowing installation rates in China, severely weakening physical demand fundamentals.
- Speculative Position Unwinding and Options Risk Hedging: Position data shows aggressive long liquidation by managed funds alongside a surge in downside option hedging, exacerbating intraday market volatility as spot silver breaks through technical support levels.
- Australian Dollar Foreign Exchange Conversion Pressures: Firming market expectations ahead of Australian inflation releases and potential hawkish rate signals from the Reserve Bank of Australia (RBA) have provided local currency strength, amplifying downward pressure on Australian dollar-denominated silver (XAG/AUD) exchange rates.
Recommended Articles


