

Silver (XAGUSD) Is down 2.01% on Oct 27: What You Need to Watch

Source Tradingkey

Silver (XAGUSD) is down 2.01% at Oct 27 02:30(ET), now at $52.854, with a 7-day down of 8.81%.
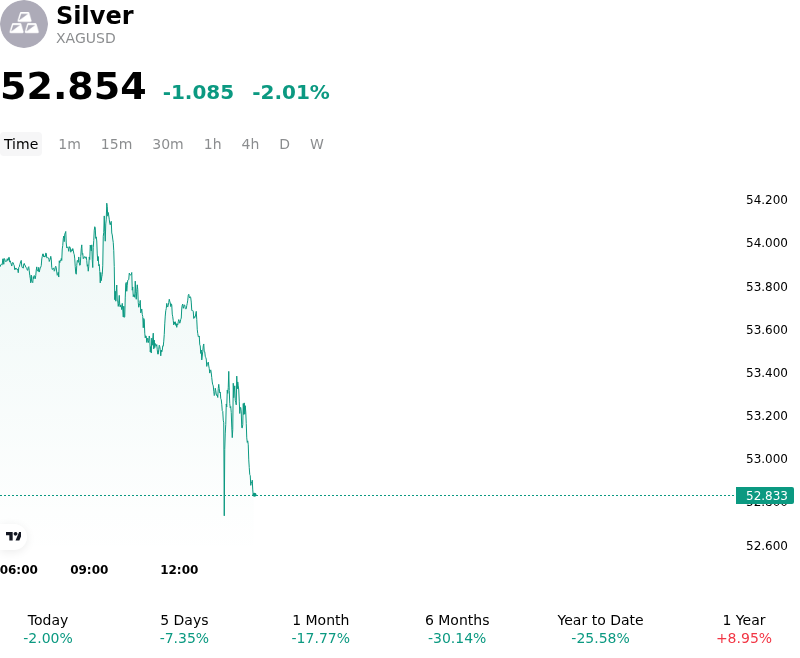
SummaryOverview

What is driving Silver (XAGUSD)’s stock price down today?

As the Federal Open Market Committee convened for its policy meeting, silver experienced notable downside pressure driven by elevated real Treasury yields and persistent market pricing for prolonged monetary policy tightening. Although investors broadly expected a pause in the benchmark interest rate for the immediate decision, persistent inflation risks maintained market expectations for potential tightening before year-end. This hawkish policy backdrop sustained elevated U.S. yields, increasing the opportunity cost of holding non-yielding precious metals and prompting institutional capital outflows.

Beyond macroeconomic policy headwinds, silver suffered from softening industrial demand expectations, causing the metal to underperform gold and expanding the gold-to-silver ratio. Given silver's significant exposure to electronics, solar technology, and manufacturing sectors, cautious physical off-take and broader macroeconomic demand concerns weighed on the forward supply-demand balance. Speculative market participants scaled back long exposure in response to sluggish industrial sentiment, leaving prices vulnerable to increased selling pressure.

Technical momentum and derivative market positioning further exacerbated the drop. A breach of key short-term technical support levels near multi-month lows triggered automated stop-loss orders and accelerated liquidations in paper and futures contracts. Concurrently, a pullback in energy prices reduced immediate geopolitical inflation risk premiums, sparking further unwinding of short-term inflation-hedging positions. Institutional investors continue to monitor upcoming central bank policy statements, real yield trends, and physical inventory flows to assess whether current price levels signal structural support or sustained downside momentum.

Technical Analysis of Silver (XAGUSD)

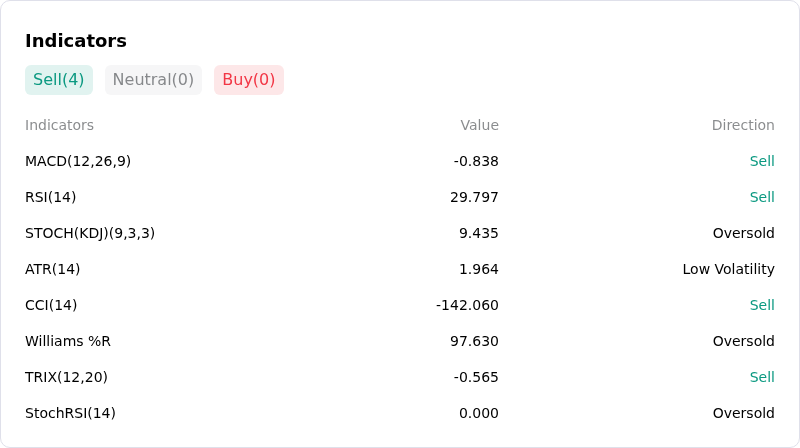
Technically, Silver (XAGUSD) shows a MACD (12,26,9) value of -0.838, indicating a sell signal. The RSI at 29.797 suggests sell condition and the Williams %R at 97.630 suggests oversold condition. Please monitor closely.
IndicatorAnalysis

More details about Silver (XAGUSD)

Recent Events and Risks:

  • Hawkish Federal Reserve Rate Policy: Surging energy prices have revived inflation concerns, heightening expectations that the Federal Reserve will hold interest rates elevated in the 3.75%–4.00% target range and delay monetary easing, which increases the opportunity cost of holding non-yielding spot silver.
  • Margin Calls and Forced Position Liquidation: Widespread equity market sell-offs and steep losses in technology shares have triggered liquidity stress and fund positioning unwinds, forcing traders to liquidate spot silver holdings to meet broker margin calls.
  • Weakening Industrial and Photovoltaic Demand: Industry projections highlighting aggressive thrifting of silver in solar panel manufacturing alongside slowing industrial consumption threaten to transition the physical silver balance toward a market surplus, undermining industrial demand support.
  • Technical Support Breakdown: Spot silver broke key technical support near $54.00 and established a fresh multi-month low at $53.03, turning prior support zones into heavy overhead resistance and exposing XAGUSD to renewed algorithmic selling pressure.
Disclaimer: For information purposes only. Past performance is not indicative of future results.
placeholder
The Fed will sit still on October 28 — but 100 of 100 economists now expect a December hikeA Reuters poll run October 16-20 found 94 of 100 economists expecting the Fed to hold at 3.75-4.00% on October 28 — and all 100 expecting a hike in December, against less than half a month earlier. The market is close to the same price, with CME FedWatch at roughly 17% for October and 82.8% for December. With the Fed in blackout since October 17, here are the five dates that decide the rest of the year, what each one is priced for, and the two directions each can take.
Author  Irene Q.
Oct 22, Thu
A Reuters poll run October 16-20 found 94 of 100 economists expecting the Fed to hold at 3.75-4.00% on October 28 — and all 100 expecting a hike in December, against less than half a month earlier. The market is close to the same price, with CME FedWatch at roughly 17% for October and 82.8% for December. With the Fed in blackout since October 17, here are the five dates that decide the rest of the year, what each one is priced for, and the two directions each can take.
placeholder
Gold Price Analysis Today | Forex Gold Analysis | XAU/USD Analysis - October 26, 2026Get the latest gold price analysis, forex gold insights, and XAU/USD analysis for October 26, 2026. Read on for the details.
Author  Mitrade
Yesterday 01: 52
Get the latest gold price analysis, forex gold insights, and XAU/USD analysis for October 26, 2026. Read on for the details.
placeholder
Big Tech's $800 billion AI bill faces its first real test — free cash flow is the judgeAlphabet and Microsoft report after the close on October 28, Amazon on October 29, with hyperscaler AI capex running near $800 billion a year. Meta's negative free cash flow and 9.40% drop on October 22 was the warning; this week's prints decide whether cloud growth and backlog can pay for the buildout. Here are the consensus numbers, the free-cash-flow table and the two-sided test.
Author  Irene Q.
Yesterday 05: 32
Alphabet and Microsoft report after the close on October 28, Amazon on October 29, with hyperscaler AI capex running near $800 billion a year. Meta's negative free cash flow and 9.40% drop on October 22 was the warning; this week's prints decide whether cloud growth and backlog can pay for the buildout. Here are the consensus numbers, the free-cash-flow table and the two-sided test.
placeholder
Gold breaks $4,000 as oil becomes the inflation problem — $3,943 is the line that mattersSpot gold closed at $3,995.6 on October 23, down about 4.1% for the week and at its lowest since mid-July, and traded near $3,988 on October 26 even as Brent crude settled at $116.72 and Middle East supply risk stayed elevated. The war premium stopped working because oil is now the inflation trade: December Fed hike odds are 68.9% and the 10-year yield is 4.988%. Here are the three numbers, the transmission chain, and the July low at $3,943 that decides whether this is a bottom or a bigger correction.
Author  Irene Q.
Yesterday 06: 41
Spot gold closed at $3,995.6 on October 23, down about 4.1% for the week and at its lowest since mid-July, and traded near $3,988 on October 26 even as Brent crude settled at $116.72 and Middle East supply risk stayed elevated. The war premium stopped working because oil is now the inflation trade: December Fed hike odds are 68.9% and the 10-year yield is 4.988%. Here are the three numbers, the transmission chain, and the July low at $3,943 that decides whether this is a bottom or a bigger correction.
placeholder
Bitcoin Price Forecast: Drops Below $80,000 in Fifth Straight Loss, May Test $75,000 as FOMC Meeting Approaches Bitcoin falls below the $80,000 mark as the October FOMC decision approaches, threatening a further dip toward $75,000.On October 26, Bitcoin (BTC) again lost the key psychological mark o
Author  TradingKey
22 hours ago
Bitcoin falls below the $80,000 mark as the October FOMC decision approaches, threatening a further dip toward $75,000.On October 26, Bitcoin (BTC) again lost the key psychological mark o
goTop
quote