


US Cocoa Futures (COCOA-F) Is down 2.24% on Sep 15: Here Is Why
US Cocoa Futures (COCOA-F) is down 2.24% at Sep 15 05:00(ET), now at $5884.5, with a 7-day down of 0.59%.
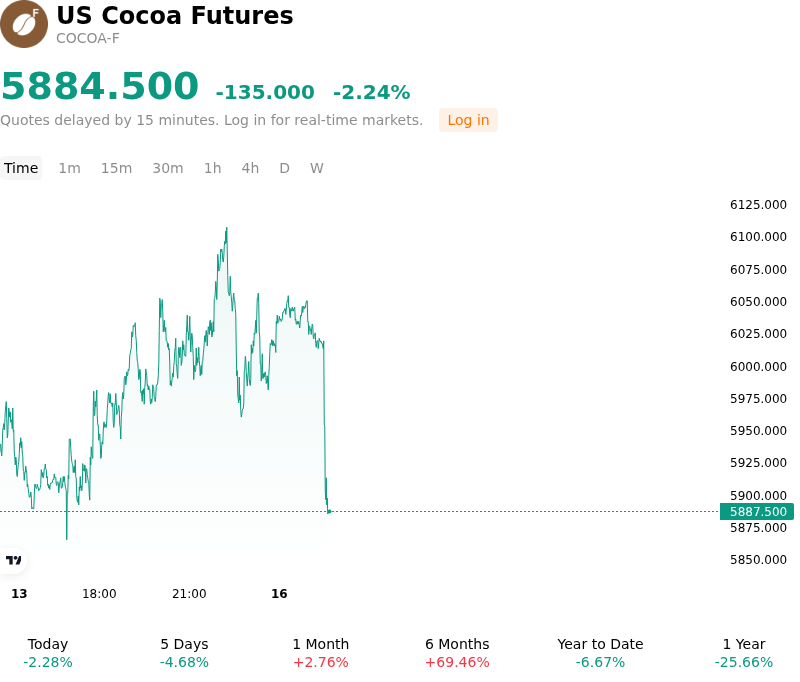
What is driving US Cocoa Futures (COCOA-F)’s stock price down today?
The downward pressure on cocoa futures was primarily driven by evidence of comfortable near-term physical availability and expanding exchange-monitored stocks. Cumulative port arrivals in Côte d'Ivoire, the world's leading producer, demonstrated a robust expansion compared to the prior season, reassuring market participants regarding immediate spot availability. This steady flow of physical supply was reinforced by high exchange-tracked inventory levels in ICE warehouses, which continue to hover near multi-year highs, signaling that physical supply pipelines remain well-stocked ahead of the main crop harvest.
Demand expectations and market sentiment were further tempered by commentary from major global cocoa processors indicating that the global market remains adequately supplied. Large chocolate manufacturers have rebuilt inventory buffers, reducing the urgency for immediate spot purchasing and mitigating fears of severe structural deficits. While medium-term risks persist regarding crop quality in West Africa due to localized disease risks and wet weather patterns, the immediate presence of heavy port deliveries and elevated warehouse inventories encouraged long position holders to lock in profits following earlier price advances.
From a positioning and market structure perspective, the pullback reflects profit-taking by institutional investors and trend-following funds. Although supply forecasts for secondary West African producers like Ghana remain under scrutiny due to structural tree aging and disease pressure, current price action highlights a market prioritizing near-term inventory abundance over speculative longer-term crop concerns. Traders continue to monitor port delivery paces, currency fluctuations, and upcoming main-crop pod count assessments to gauge whether current inventory cushions will suffice to meet global processing demand.
Technical Analysis of US Cocoa Futures (COCOA-F)
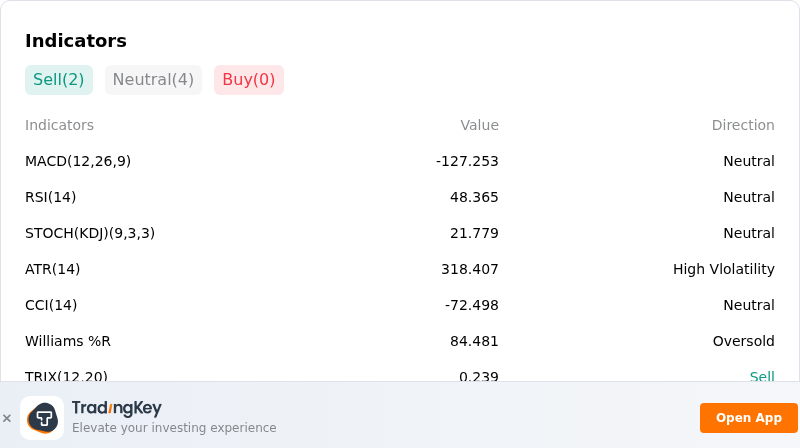
Technically, US Cocoa Futures (COCOA-F) shows a MACD (12,26,9) value of -127.253, indicating a neutral signal. The RSI at 48.365 suggests neutral condition and the Williams %R at 84.481 suggests oversold condition. Please monitor closely.
More details about US Cocoa Futures (COCOA-F)
Recent Events and Risks:
- Surging West African Port Deliveries: Recent cumulative shipment data from top producer Ivory Coast showed port deliveries reaching 2.14 million metric tons for the 2025/26 season through mid-September, an 18% increase year-over-year, alongside a 30% expansion in total harvest output, placing heavy spot supply pressure on nearby futures.
- Multi-Year High Exchange Warehouse Inventories: ICE-monitored cocoa warehouse stocks climbed to a two-year peak above 3.42 million bags, while global processors like Barry Callebaut noted that world market inventory cushions of roughly 500,000 metric tons are providing a solid buffer against immediate supply disruptions.
- Front-Month Expiry and Curve Unwinding: With the September 2026 futures contract reaching final expiration on September 15, intense liquidation and mandatory rolling of open interest into December 2026 contracts triggered sharp intraday sell-offs and flattened long-dated risk premiums across the forward curve.
- Demand Deterioration and Recipe Reformulation: High cocoa bean costs over consecutive cycles have driven end-user demand destruction, with major chocolate manufacturers actively altering product recipes, substituting cocoa components, and reducing package sizes to curb physical bean procurement.
Recommended Articles


