


Amphenol Corp Stock (APH) Moved Down by 5.67% on Sep 14: Drivers Behind the Movement
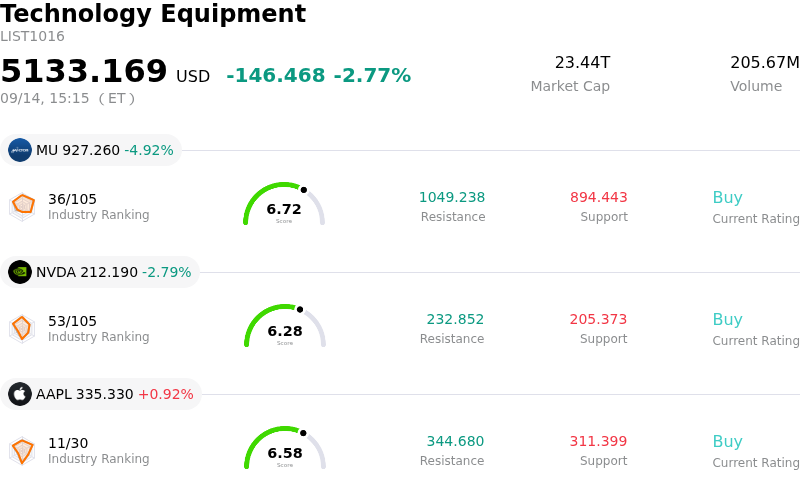
Amphenol Corp (APH) moved down by 5.67%. The Technology Equipment sector is down by 2.77%. The company underperformed the industry. Top 3 stocks by turnover in the sector: Micron Technology Inc (MU) down 4.89%; NVIDIA Corp (NVDA) down 2.76%; Apple Inc (AAPL) up 0.89%.
What is driving Amphenol Corp (APH)’s stock price down today?
Amphenol experienced noticeable downward pressure and intraday volatility as investors engaged in profit-taking following a prolonged rally driven by AI infrastructure demand and a recent two-for-one stock split. Although the company maintains strong fundamental order books in its IT datacom segment—amplified by rapid growth in AI server high-speed copper, fiber optic, and power interconnect solutions—the stock's premium valuation relative to sector peers and its own historical multiples left it vulnerable to short-term sentiment shifts.
Broader macro and industry influences also played a critical role. Sector-wide caution across technology hardware and AI supply chain constituents weighed heavily on trading sentiment. Heightened scrutiny around hyperscaler artificial intelligence capital expenditure timelines, combined with market sensitivity regarding monetary policy and interest rate expectations, led institutional investors to reduce exposure in elevated-multiple growth names. While recent analyst updates highlighted Amphenol's strong long-term catalyst pipeline and expansion from strategic acquisitions, the stock's premium valuation compressed its margin of safety, amplifying intraday price swings.
From a strategic portfolio standpoint, the decline reflects a tactical reset driven by market-wide re-rating risk rather than a structural deterioration of Amphenol's business model. The company's diversified exposure across defense, commercial aerospace, industrial automation, and mobile devices offers substantial operational resilience. However, near-term share price behavior is expected to remain closely tied to broader tech sector momentum, data center capital expenditure pacing, and broader macroeconomic indicators.
Technical Analysis of Amphenol Corp (APH)
Technically, Amphenol Corp (APH) shows a MACD (12,26,9) value of 0.009, indicating a buy signal. The RSI at 46.500 suggests neutral condition and the Williams %R at 78.819 suggests sell condition. Please monitor closely.
Media Coverage of Amphenol Corp (APH)
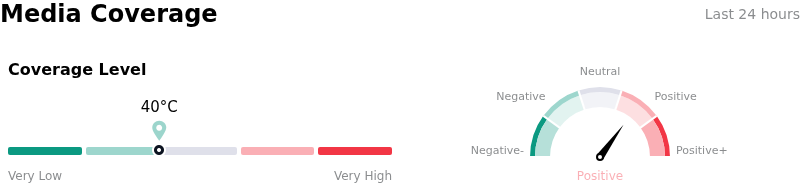
In terms of media coverage, Amphenol Corp (APH) shows a coverage score of 40, indicating a low level of media attention. The overall market sentiment index is currently in bullish zone.
Fundamental Analysis of Amphenol Corp (APH)
Amphenol Corp (APH) is in the Technology Equipment industry. Its latest annual revenue is $23.09B, ranking 4 in the industry. The net profit is $4.27B, ranking 1 in the industry. Company Profile
Over the past month, multiple analysts have rated the company as Buy, with an average price target of $98.79, a high of $115.00, and a low of $85.00.
More details about Amphenol Corp (APH)
Company Specific Risks:
- AI Data Center Capex Overconcentration: IT datacom sales account for 43% of total revenues driven by AI infrastructure demand, leaving the company heavily vulnerable to sudden pullbacks, project pauses, or capex rebalancing by key hyperscaler customers.
- Elevated Net Debt and Cash Flow Compression: Carrying $13.4 billion in net debt and increased quarterly interest expenses following the CommScope CCS acquisition, free cash flow margins have contracted to 13.7% from 19.8% a year prior, reducing financial flexibility.
- Extreme Valuation Multiples and Insider Liquidations: Trading at a trailing earnings multiple near 40x—significantly higher than the broader electronic industry average of 29.8x—valuation models indicate negative margins of safety, compounded by over $500 million in net insider stock sales over the past year.
- Architectural Mix Shift and Margin Execution Risks: An evolving customer shift in data center design from high-margin, high-speed copper interconnects toward optical networking threatens to compress operating margins if increased manufacturing, logistics, and scaling costs absorb top-line gains.
Recommended Articles


