


Bank of America Corp Stock (BAC) Moved Down by 5.60% on Sep 14: Facts Behind the Movement
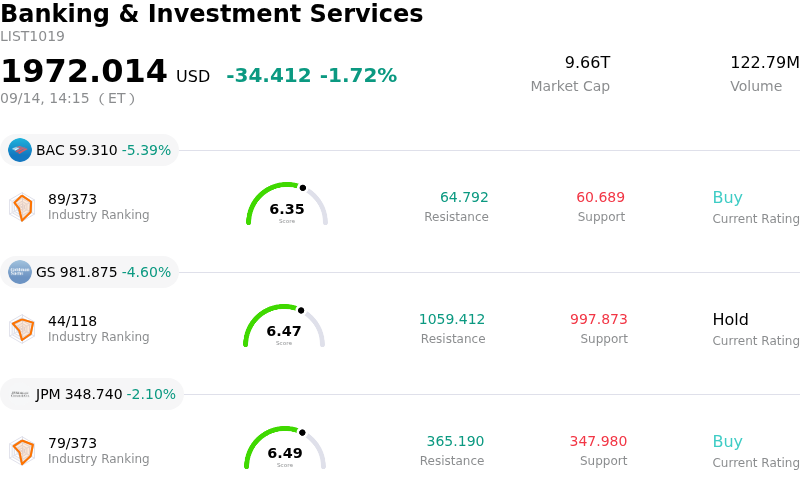
Bank of America Corp (BAC) moved down by 5.60%. The Banking & Investment Services sector is down by 1.72%. The company underperformed the industry. Top 3 stocks by turnover in the sector: Bank of America Corp (BAC) down 5.46%; Goldman Sachs Group Inc (GS) down 4.60%; JPMorgan Chase & Co (JPM) down 2.18%.
What is driving Bank of America Corp (BAC)’s stock price down today?
Bank of America Corporation experienced a sharp pullback as a confluence of macroeconomic headwinds, rising benchmark interest rates, and industry-wide cautiousness weighed heavily on the financial sector. Broad market sentiment turned distinctly risk-averse ahead of the Federal Reserve policy decision, driven by escalating geopolitical friction in the Middle East and rising energy prices that reignited inflationary concerns. As benchmark Treasury yields marched higher, equity valuations across major banking institutions faced immediate pressure due to elevated cost-of-capital assumptions and shifting expectations regarding monetary policy easing.
The decline was further catalyzed by executive messaging during the Barclays Global Financial Services Conference, where Chief Executive Officer Brian Moynihan addressed investors. Market participants paid close attention to comments regarding net interest margin trajectory, deposit pricing dynamics, and investment banking pipelines. With investors hyper-focused on whether peak interest income benefits are waning and how credit quality may evolve under higher-for-longer borrowing rates, any conservative tone or updated guidance prompted swift risk management from institutional holders.
Additionally, technical positioning and options market activity amplified the downside momentum. Following a sustained rally over prior quarters, institutional portfolio managers actively trimmed bank holdings to lock in profits amidst macroeconomic uncertainty. Increased demand for downside protection drove implied volatility upward, accelerating intraday selling pressure. Despite solid underlying capital ratios and digital banking expansion, near-term stock performance remains tightly linked to macroeconomic developments, interest rate expectations, and upcoming quarterly earnings clarity.
Technical Analysis of Bank of America Corp (BAC)
Technically, Bank of America Corp (BAC) shows a MACD (12,26,9) value of -0.481, indicating a neutral signal. The RSI at 33.965 suggests neutral condition and the Williams %R at 96.624 suggests oversold condition. Please monitor closely.
Media Coverage of Bank of America Corp (BAC)
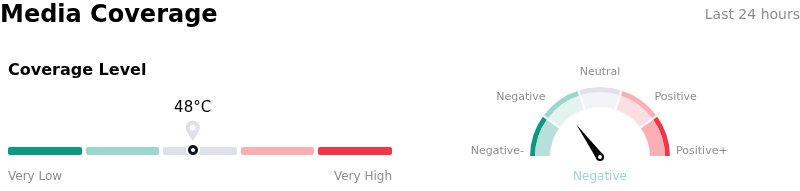
In terms of media coverage, Bank of America Corp (BAC) shows a coverage score of 48, indicating a moderate level of media attention. The overall market sentiment index is currently in bearish zone.
Fundamental Analysis of Bank of America Corp (BAC)
Bank of America Corp (BAC) is in the Banking & Investment Services industry. Its latest annual revenue is $104.06B, ranking 2 in the industry. The net profit is $29.05B, ranking 2 in the industry. Company Profile
Over the past month, multiple analysts have rated the company as Buy, with an average price target of $67.81, a high of $79.00, and a low of $48.00.
More details about Bank of America Corp (BAC)
Company Specific Risks:
- Investment Banking Fee Guidance Downgrade: Speaking at the Barclays Global Financial Services Conference, CEO Brian Moynihan cautioned that third-quarter investment banking fees are expected to fall at least 10% year-over-year to between $1.6 billion and $1.8 billion due to broader industry slowdowns in dealmaking.
- Elevated Options Implied Volatility and Put Skew: Institutional options trading showed a marked rise in near-term downside protection, with 30-day implied volatility increasing to 25.02 alongside a steepening put-call skew, signaling growing market anticipation of an intraday price pullback.
- Institutional Position Trimming and Insider Selling: Recent disclosures highlight a trend of executive insider liquidations alongside reduced institutional conviction, as 28 of 34 major money managers trimmed their BAC equity stakes following the stock's recent multi-month rally.
- Sensitivity to Capital Markets Volatility: Wall Street research warned that elevated Treasury yield volatility and potential forced liquidations from systematic trading strategies pose immediate headwinds to Bank of America's market-sensitive sales and trading revenues.
Recommended Articles


